
Getting Started with Sequack
Complete guide to setting up DMARC protection, monitoring email authentication, and securing your domain with Sequack
Getting Started with Sequack
Welcome to Sequack! This comprehensive guide will walk you through setting up complete DMARC protection for your domain, from initial setup to advanced monitoring and threat detection.
What is Sequack?
Sequack is a powerful DMARC management platform that helps you:
- Protect your domain from email spoofing and phishing attacks
- Monitor email authentication with real-time aggregate and forensic reports
- Analyze threats with built-in digital forensics and threat intelligence
- Achieve compliance through phase-based policy enforcement
- Collaborate with your team using role-based access control
Note: DMARC (Domain-based Message Authentication, Reporting and Conformance) builds on SPF and DKIM to provide comprehensive email authentication and reporting.
In This Guide
✅ Creating your account and initial setup
✅ Adding and verifying domains
✅ Understanding the Dashboard
✅ Configuring DMARC policies
✅ Reading aggregate and forensic reports
✅ Using the Phases feature for policy enforcement
✅ Setting up alerts and monitoring
✅ Exploring security tools and features
Step 1: Create Your Account
Choose Your Region
Sequack operates in multiple regions. Select the appropriate URL based on your location:
- UAE/Middle East users: https://ae-outpost.sequack.com
- US/International users: https://outpost.sequack.com
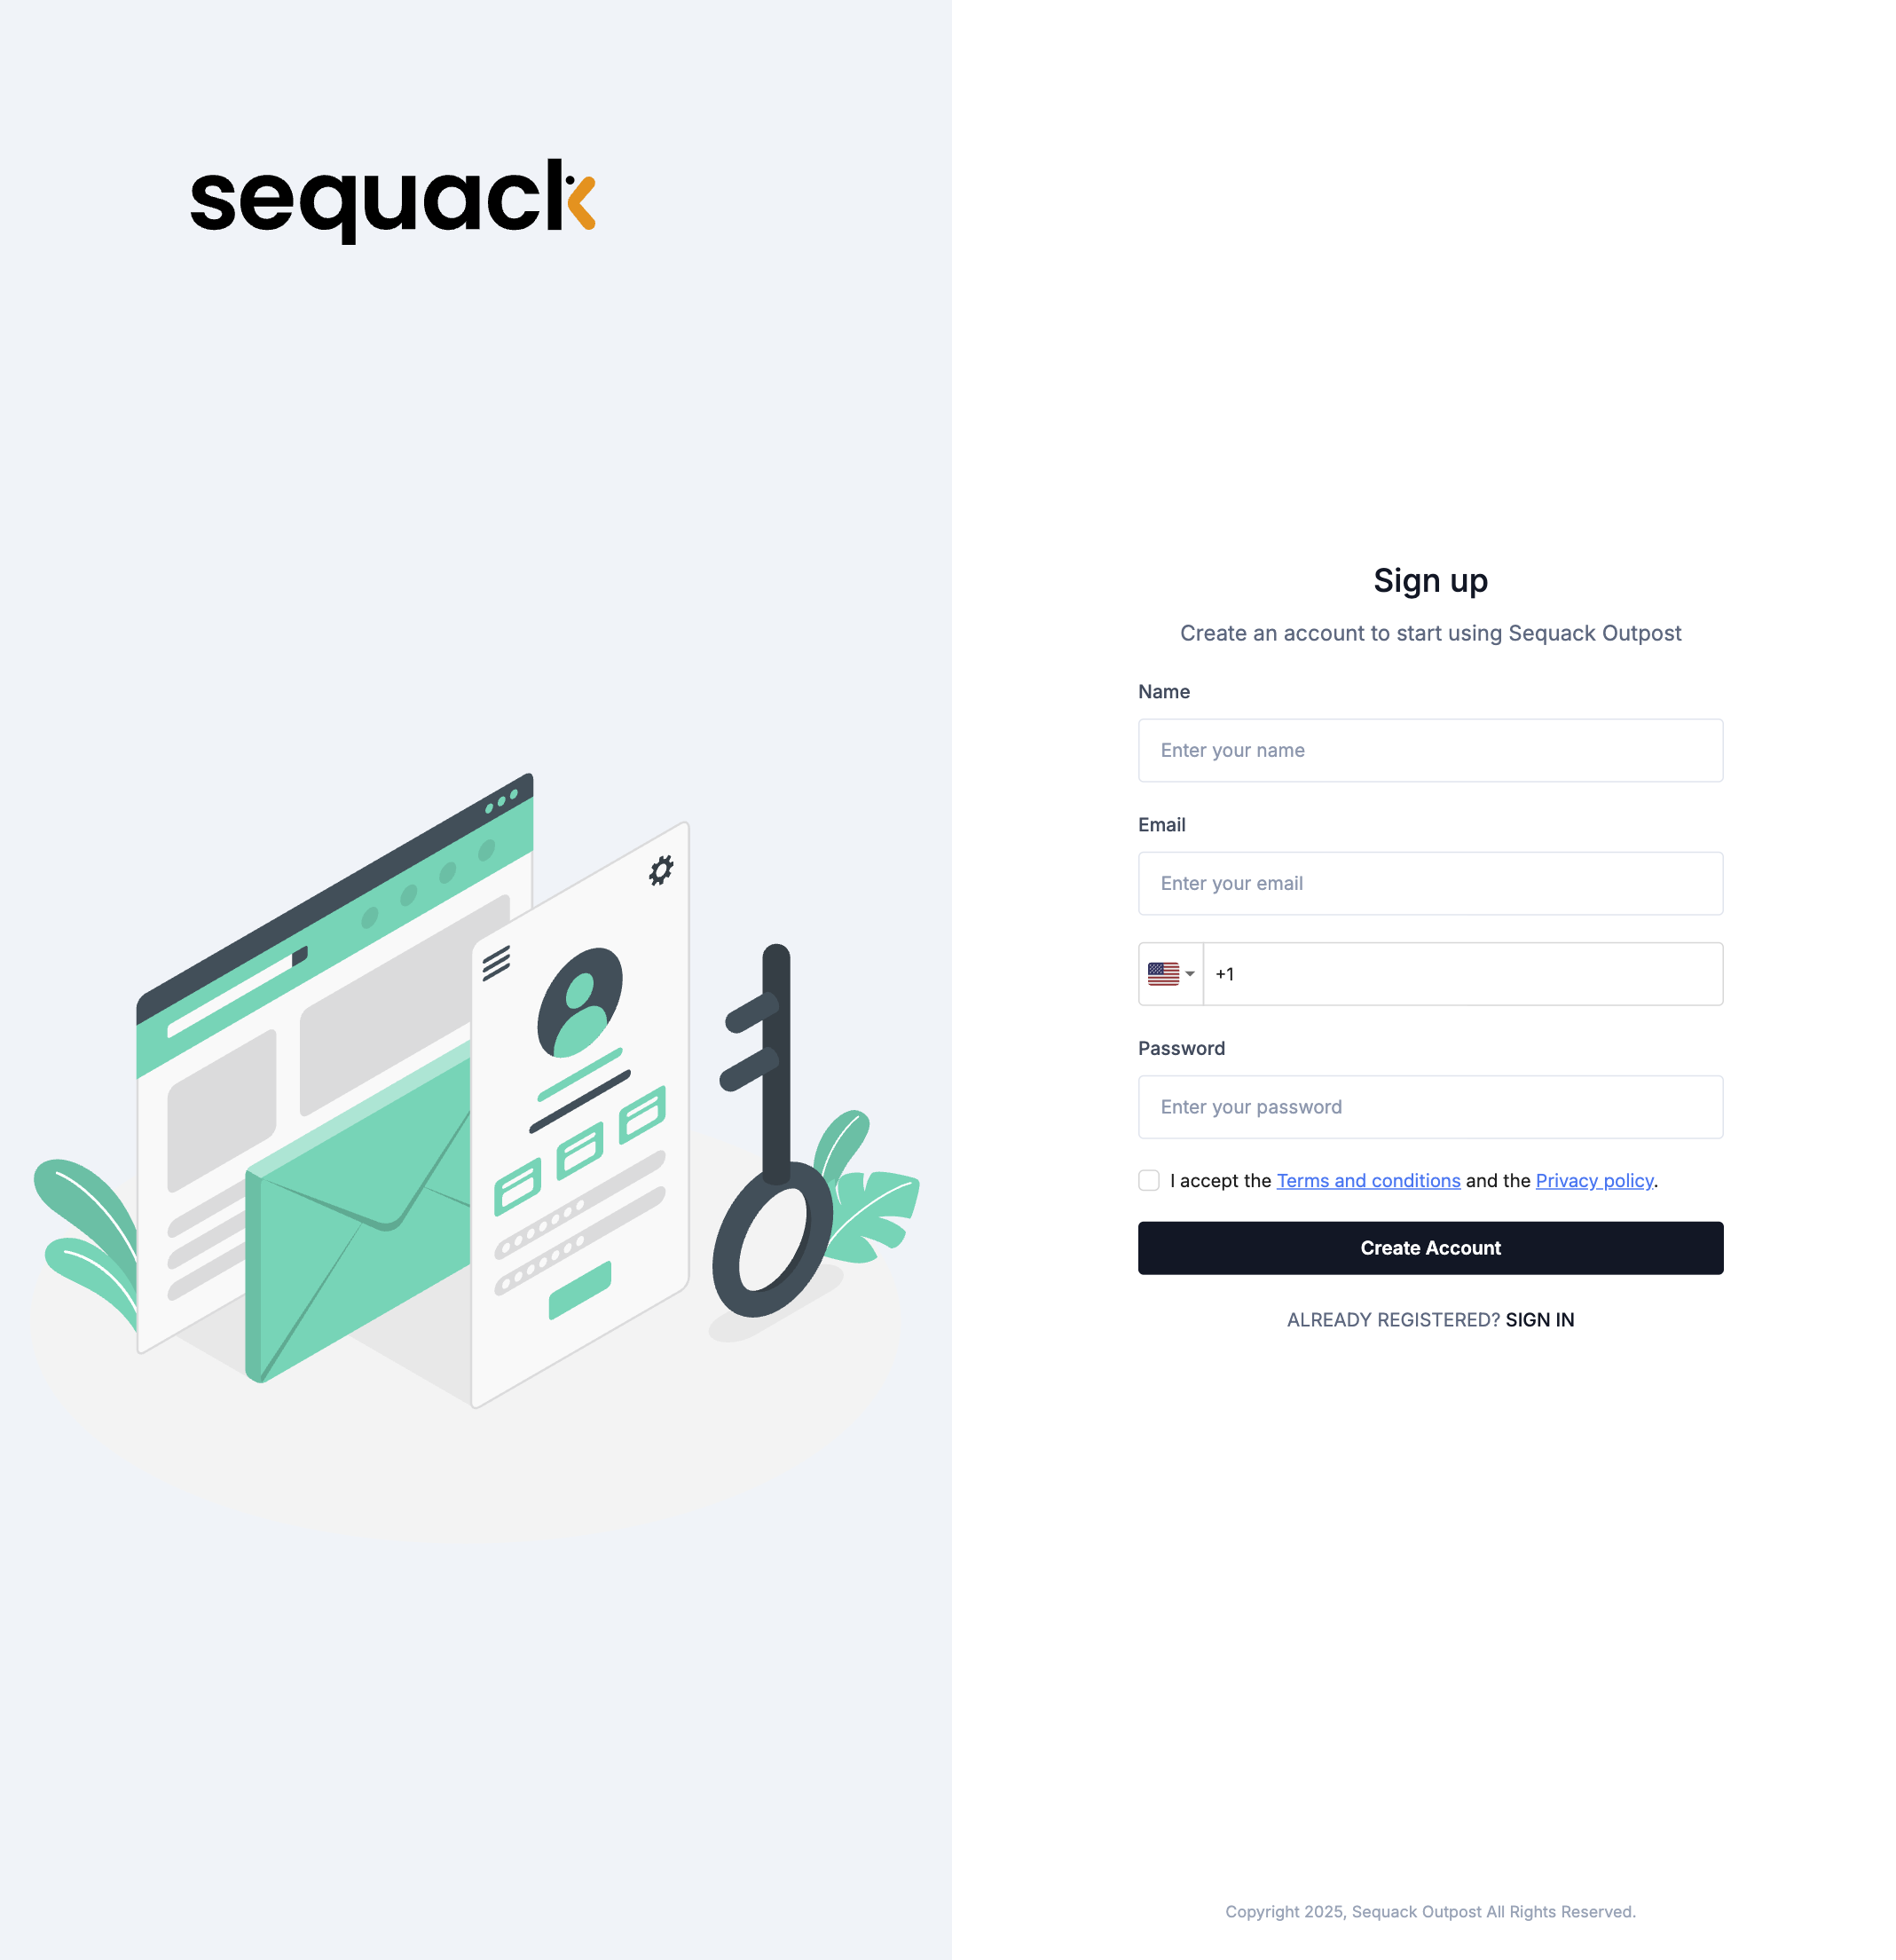
Sign Up
- Visit your region's Sequack URL (see above)
- Click "Sign Up"
- Fill in the registration form:
- Business email address
- Phone number
- Strong password (minimum 8 characters with uppercase, lowercase, and numbers)
- Accept the Terms of Service and Privacy Policy
- Click "Signup"
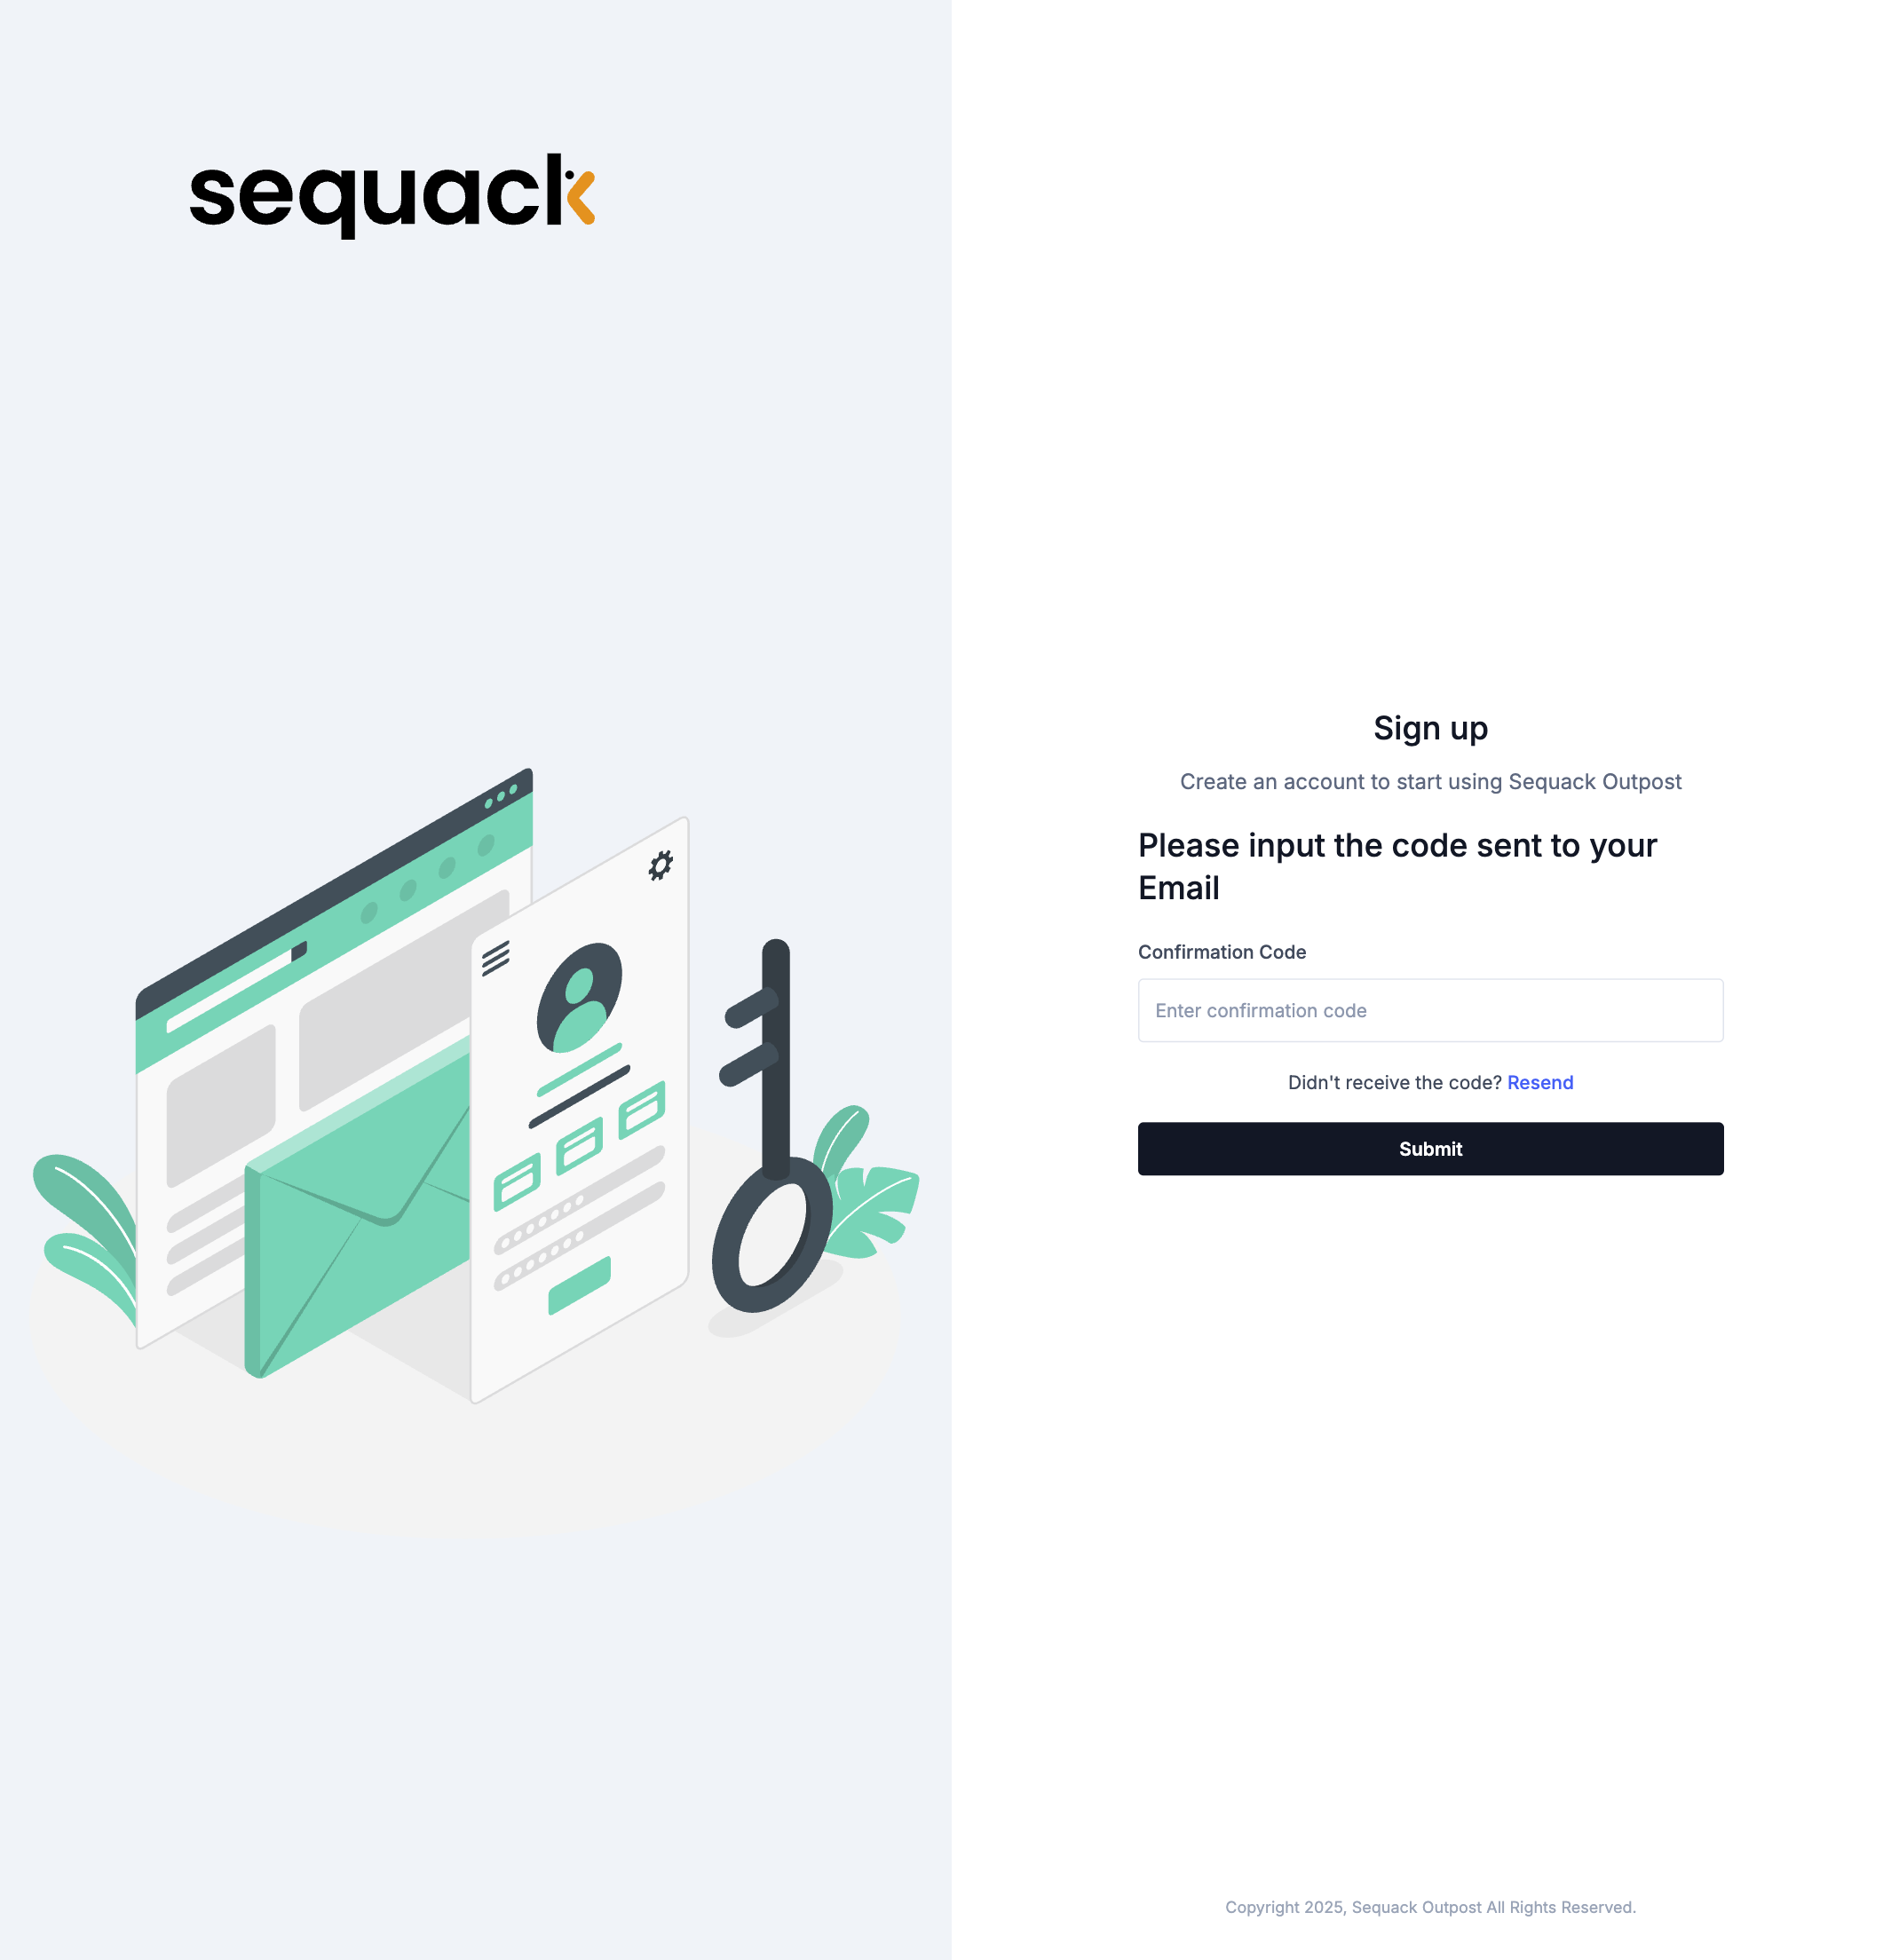
Email Verification
After clicking "Signup", you'll be prompted to verify your email:
- Check your inbox for a verification code
- UAE users: Email from
no-reply@ae-mail.outpost.sequack.com - US/International users: Email from
no-reply@mail.outpost.sequack.com
- UAE users: Email from
- Enter the verification code on the screen
- Click "Verify" to complete registration
- You'll be redirected to log in
Note: Check your spam folder if you don't receive the code within a few minutes. The code is typically valid for 10-15 minutes.
Step 2: Complete the Setup Wizard
After logging in for the first time, you'll be guided through a 3-step setup wizard to get your domain protected quickly.
Step 1: Create Organization
- Enter your Organization Name (your company name)
- Click "Continue"
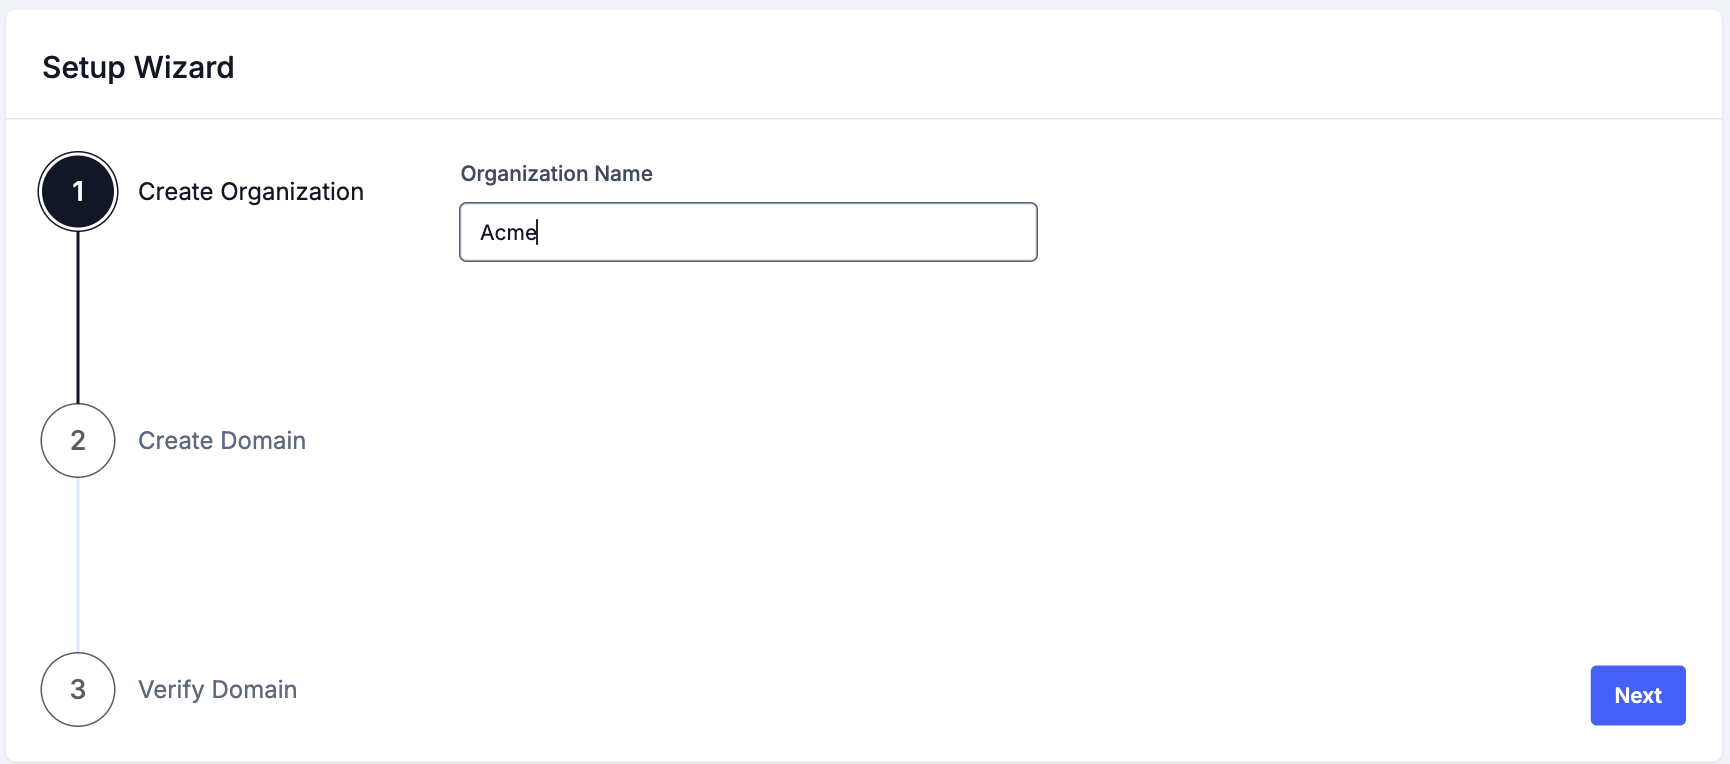
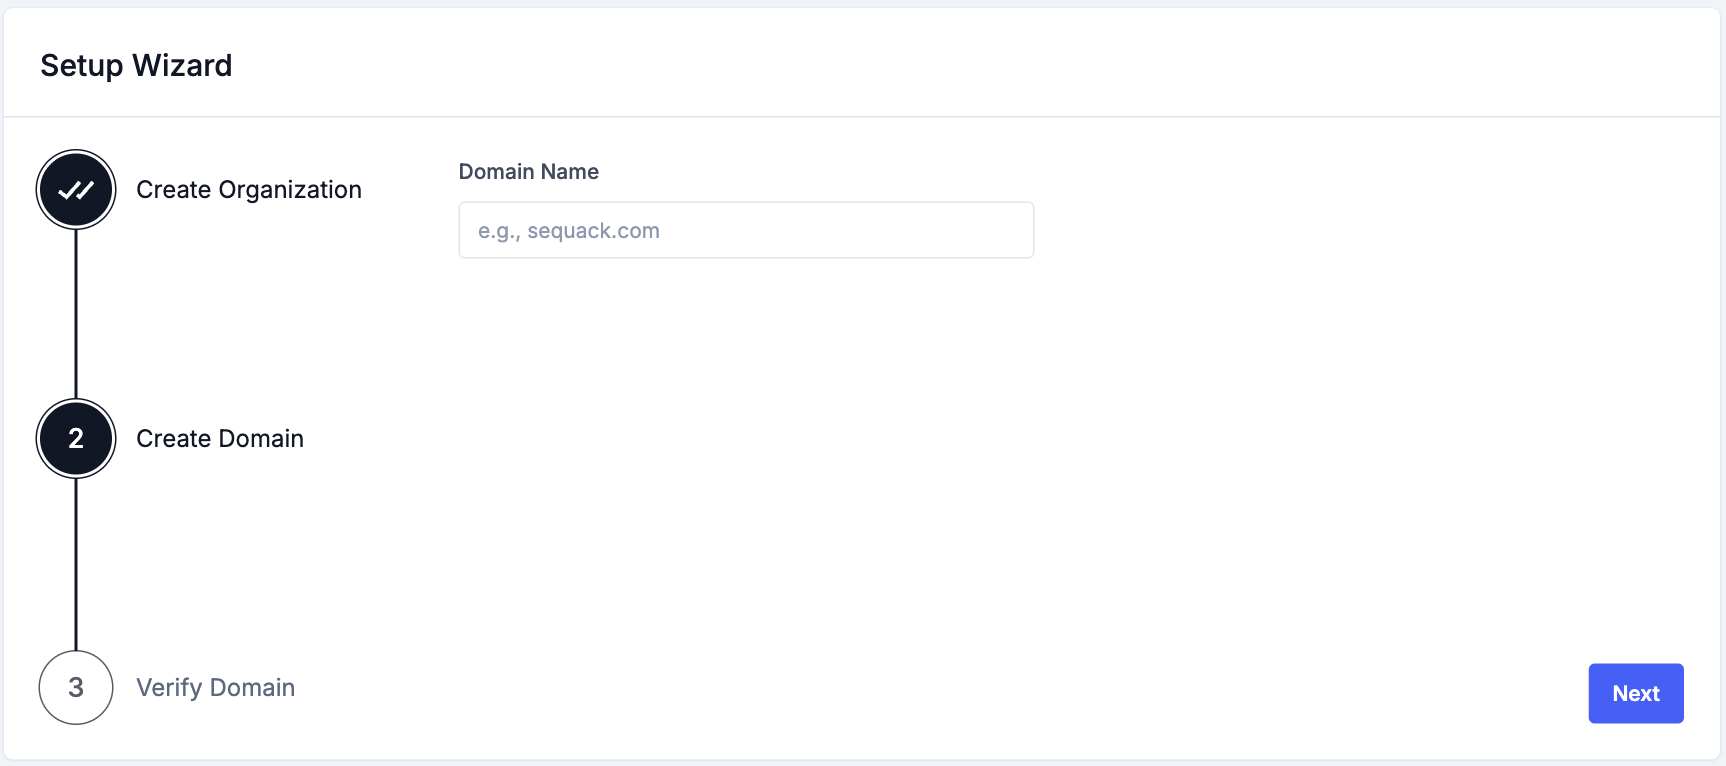
Step 2: Create Domain
- Enter your domain name (e.g.,
yourcompany.com)- Enter only the domain name without
wwworhttp:// - Use
example.comnotwww.example.com
- Enter only the domain name without
- Click "Continue"
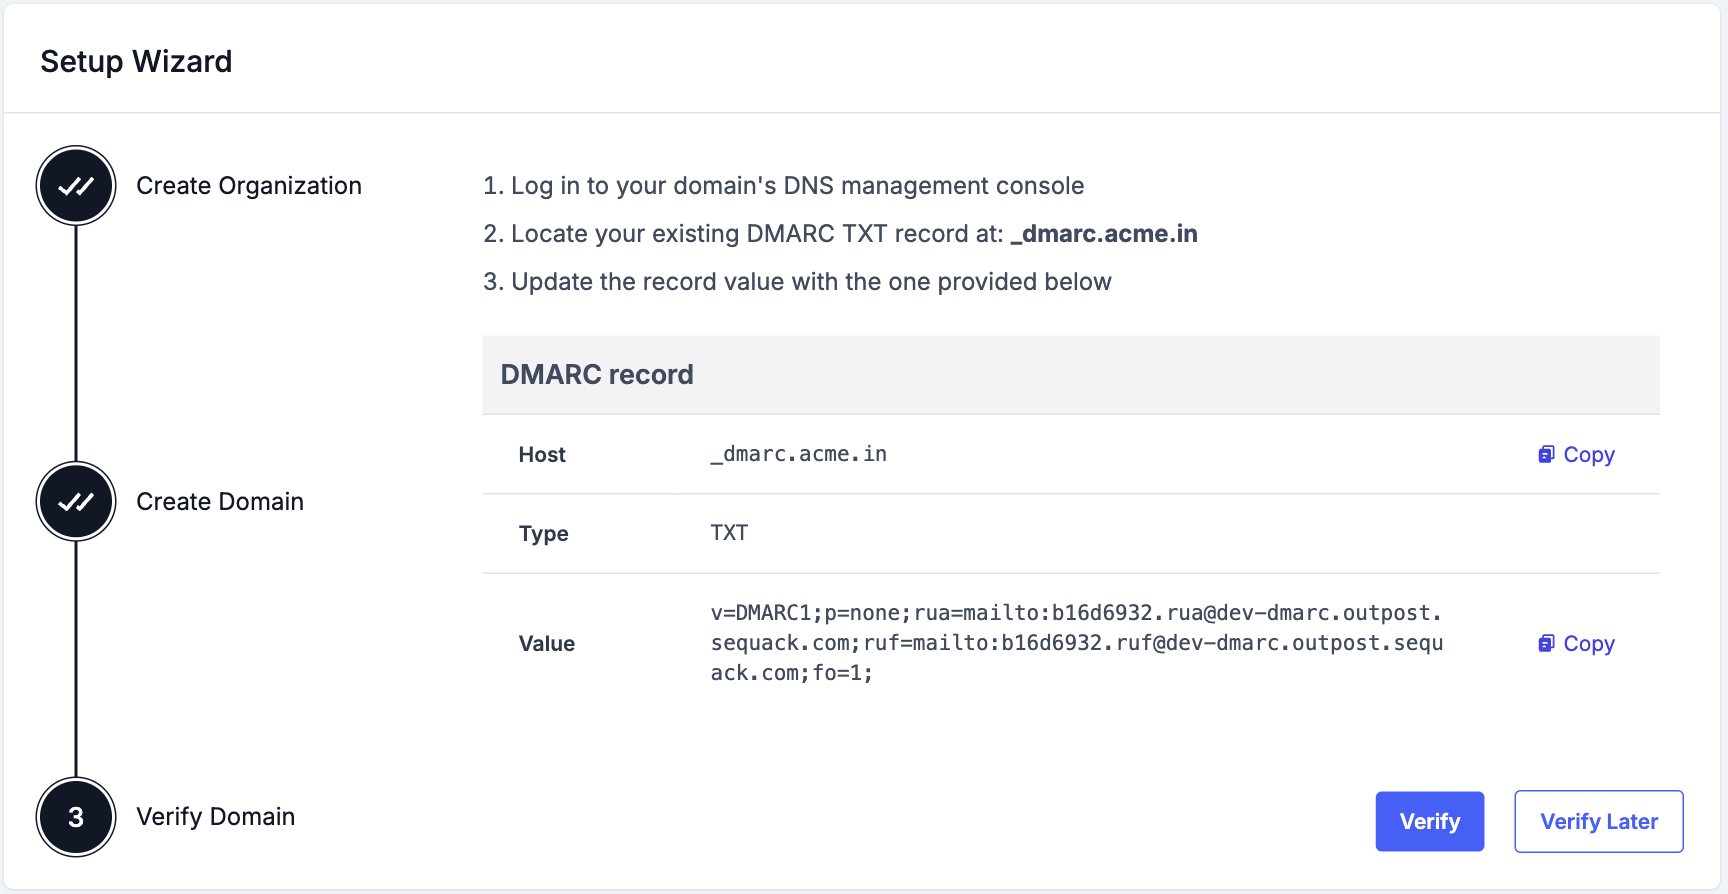
Step 3: Verify Domain
After adding your domain, Sequack will generate a DMARC TXT record for verification.
Copy DNS Record
After adding your domain, Sequack will generate a TXT record for verification:
- You'll see a TXT record displayed on screen
- Click "Copy" to copy the record to clipboard
Example:
v=DMARC1; p=none; rua=mailto:uniqid.rua@dmarc.outpost.sequack.com; ruf=uniqid.ruf@dmarc.outpost.sequack.com; pct=100
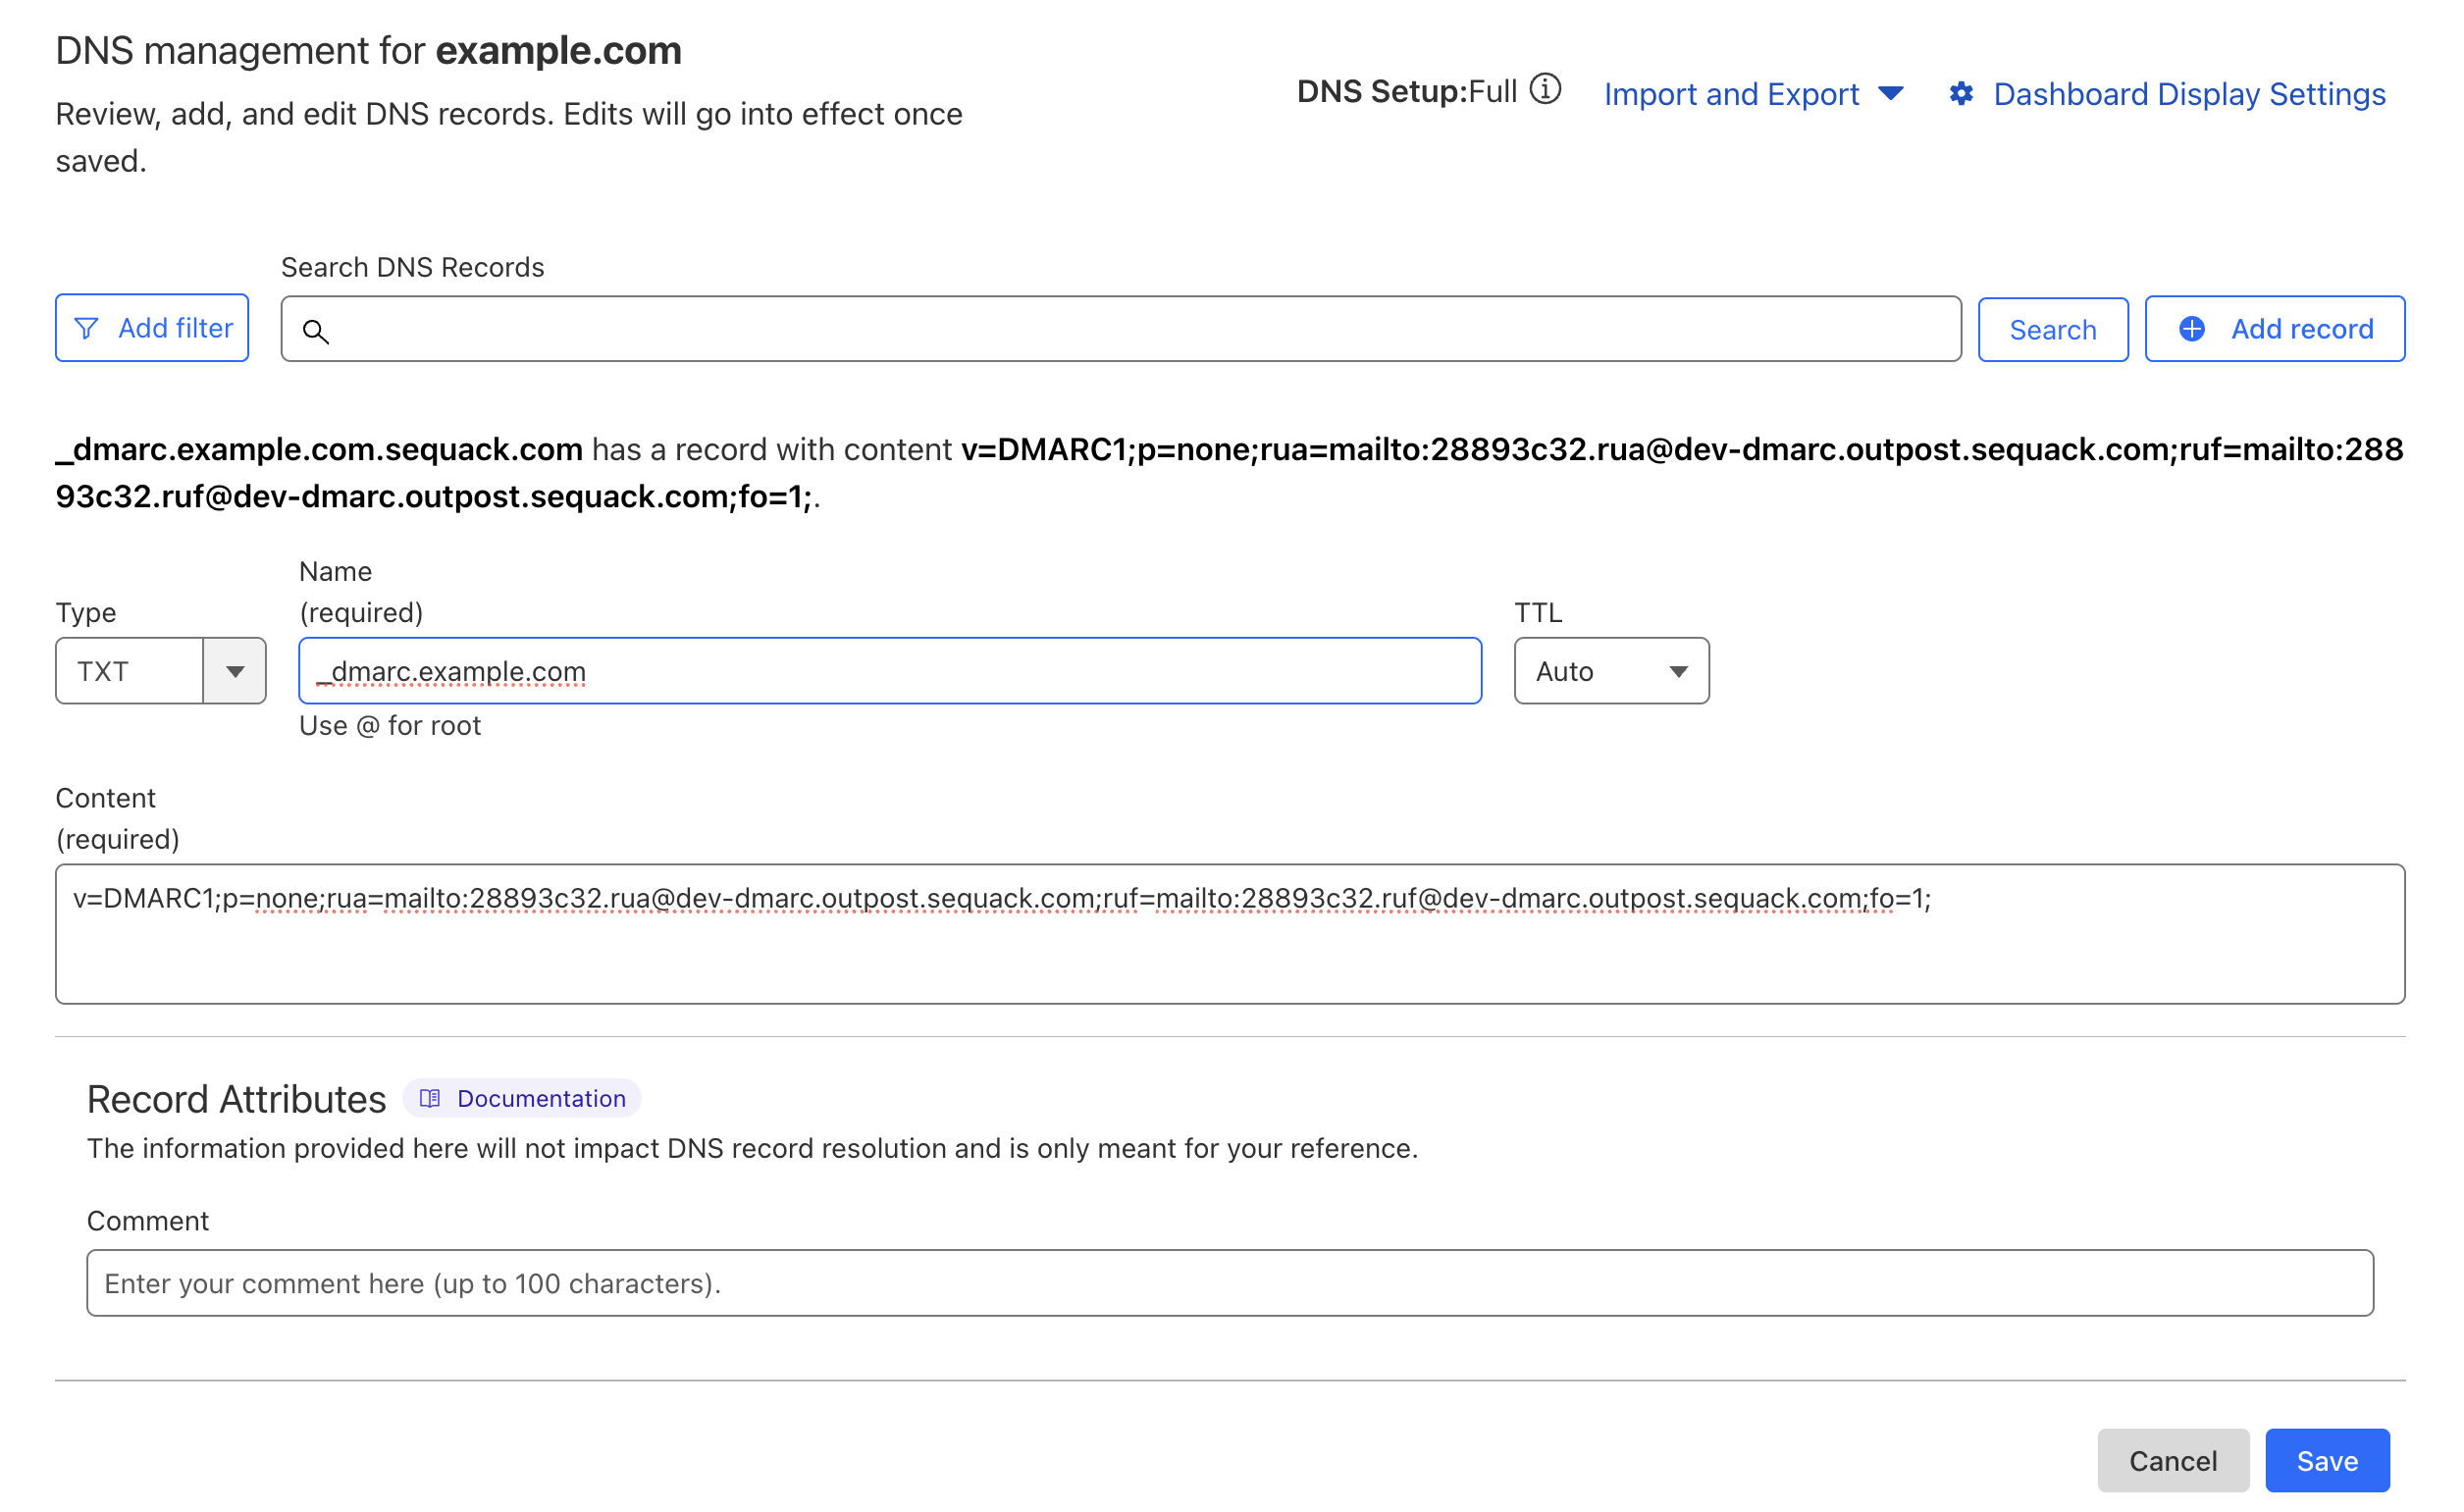
Add to DNS Provider
- Log into your DNS hosting provider (Cloudflare, GoDaddy, Route53, Namecheap, etc.)
- Navigate to DNS settings for your domain
- Create a new TXT record with these details:
| Field | Value |
|---|---|
| Host/Name | _dmarc |
| Type | TXT |
| Value | Paste the copied DMARC record |
| TTL | 3600 (or leave default) |
- Save the DNS record
Important: DNS propagation typically takes 5-30 minutes but can take up to 48 hours.
Verify Domain
After adding the DNS record, you have two options:
Option 1: Verify Now
- Click "Verify Domain"
- Wait for verification to complete (this may take a few moments)
- If successful, you'll be redirected to the Dashboard
Option 2: Verify Later
- Click "Verify Domain Later"
- You'll be redirected to the Dashboard
- You can verify your domain later from the Domains page
Note: If verification fails, it usually means DNS propagation is still in progress. Wait 10-15 minutes and try again from the Domains page.
🎉 Congratulations! You've completed the setup wizard and will be redirected to the Dashboard. Your domain is now being monitored for DMARC reports.
What happens next? You'll start receiving aggregate reports within 24 hours and forensic reports within a few hours..
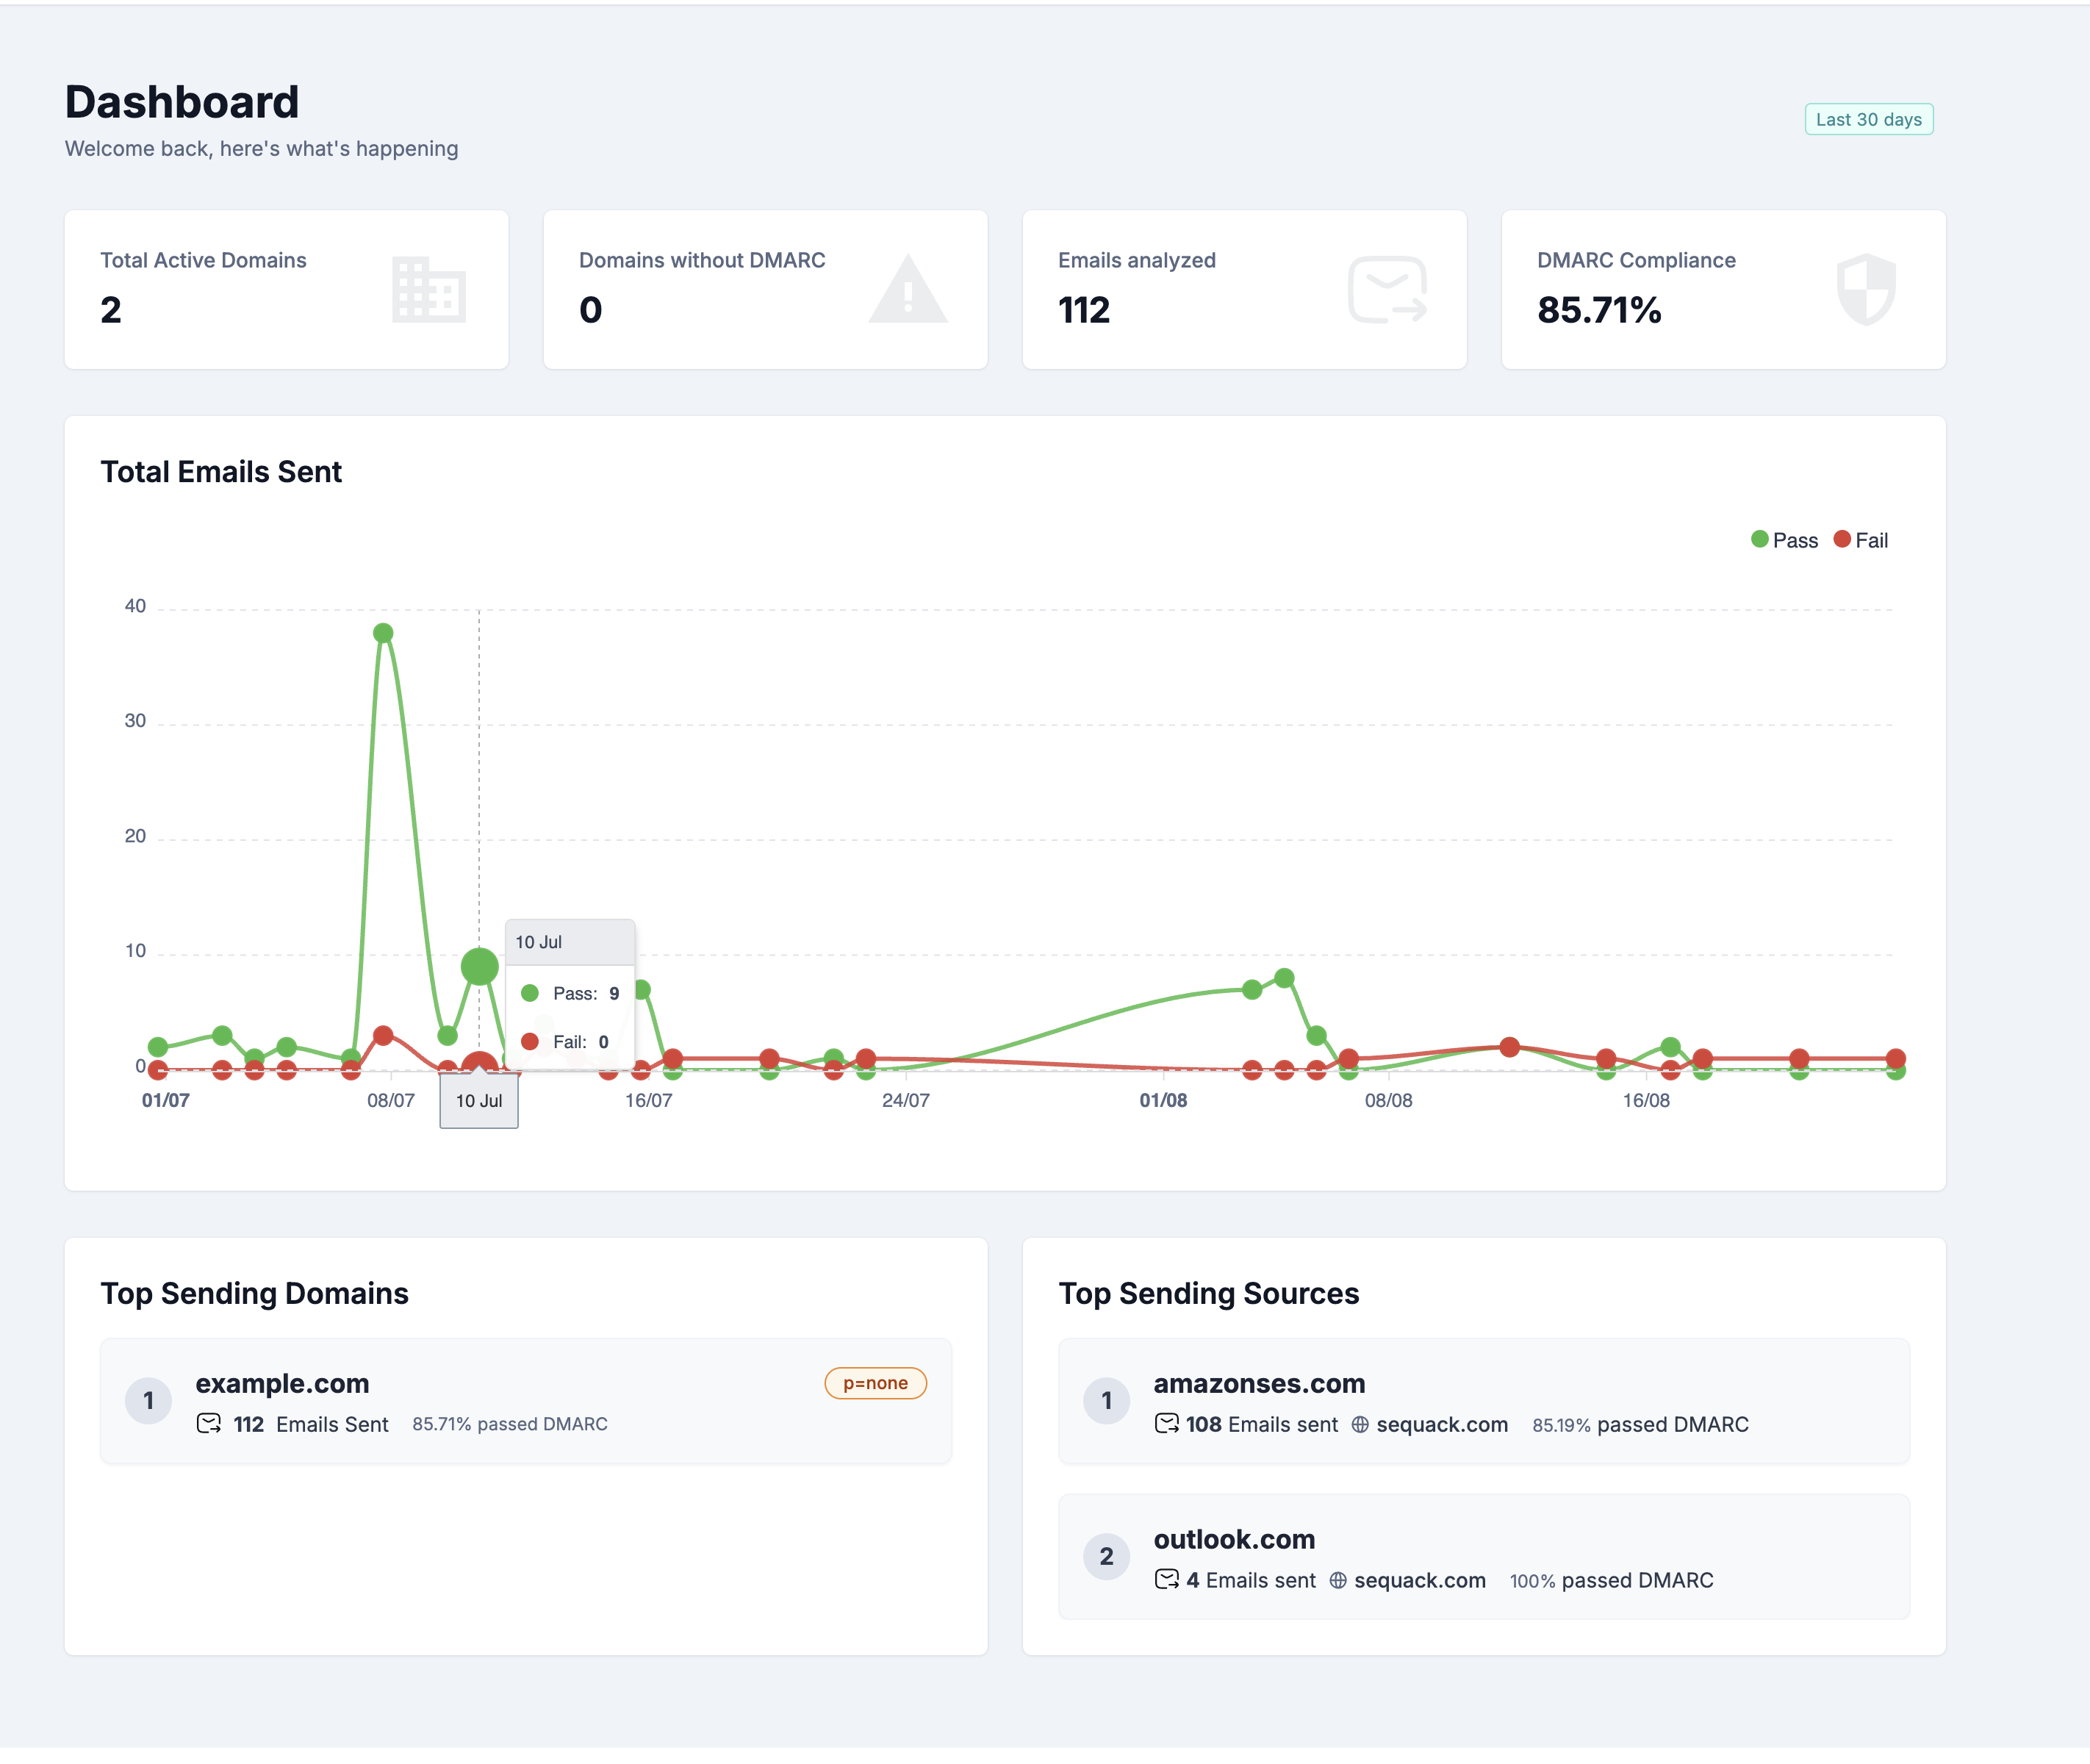
Step 3: Explore Your Dashboard
Dashboard Overview
After completing setup, you'll land on the Dashboard - your central hub for monitoring email authentication across all domains.
The dashboard shows data from the Last 30 days by default.
Key Metrics Cards
At the top, you'll see four stat cards displaying:
-
Total Active Domains
- Number of verified domains being monitored
- Helps you track your domain portfolio
-
Domains without DMARC
- Domains that don't have a DMARC policy configured
- Important to address for complete protection
-
Emails Analyzed
- Total number of emails processed across all domains
-
DMARC Compliance
- Overall percentage of emails passing DMARC authentication
- Your primary security health indicator
Total Emails Sent Chart
Below the metrics, you'll find a line chart showing:
- Email volume trends over the last 30 days
- Daily breakdown of emails sent
- Visual patterns to identify spikes or anomalies
This helps you understand your email traffic patterns at a glance.
Top Sending Domains
The Top Sending Domains list shows your most active domains:
For each domain, you'll see:
- Domain name and ranking (#1, #2, etc.)
- DMARC policy (p=none, p=quarantine, or p=reject)
- Total emails sent from this domain
- Compliance percentage - how many emails passed DMARC
Top Sending Sources
The Top Sending Sources list shows which email sources (IPs, services) send the most email:
For each source, you'll see:
- Source name (e.g., "Amazon Ses", "Google Workspace", "Mailchimp")
- Ranking (#1, #2, etc.)
- Total emails sent from this source
- Domain name it's sending for
- Compliance percentage - DMARC pass rate for this source
This is crucial for identifying which services need to be properly configured in your SPF/DKIM records.
Pro Tip: Sources with low compliance percentages (<90%) should be investigated first. They might need SPF/DKIM configuration or could indicate unauthorized senders.
Step 4: Understanding DMARC Reports
Aggregate Reports
Aggregate reports show high-level statistics about all emails sent from your domain, helping you identify sending sources and authentication patterns.
Access Aggregate Reports
- Click "DMARC Reports" in the sidebar
- Select "Aggregate Reports"
Or from the Domains page:
- Click "View Aggregate Reports" in the Actions dropdown for any domain
Filters
At the top of the page, you'll find two important filters:
- Domain Selector - Choose which domain to view reports for
- Date Range Picker - Select the time period (defaults to last 30 days)
Adjust these filters to focus on specific domains and timeframes.
Three Tabs for Different Views
The Aggregate Reports page has three tabs, each providing a different perspective on your email data:
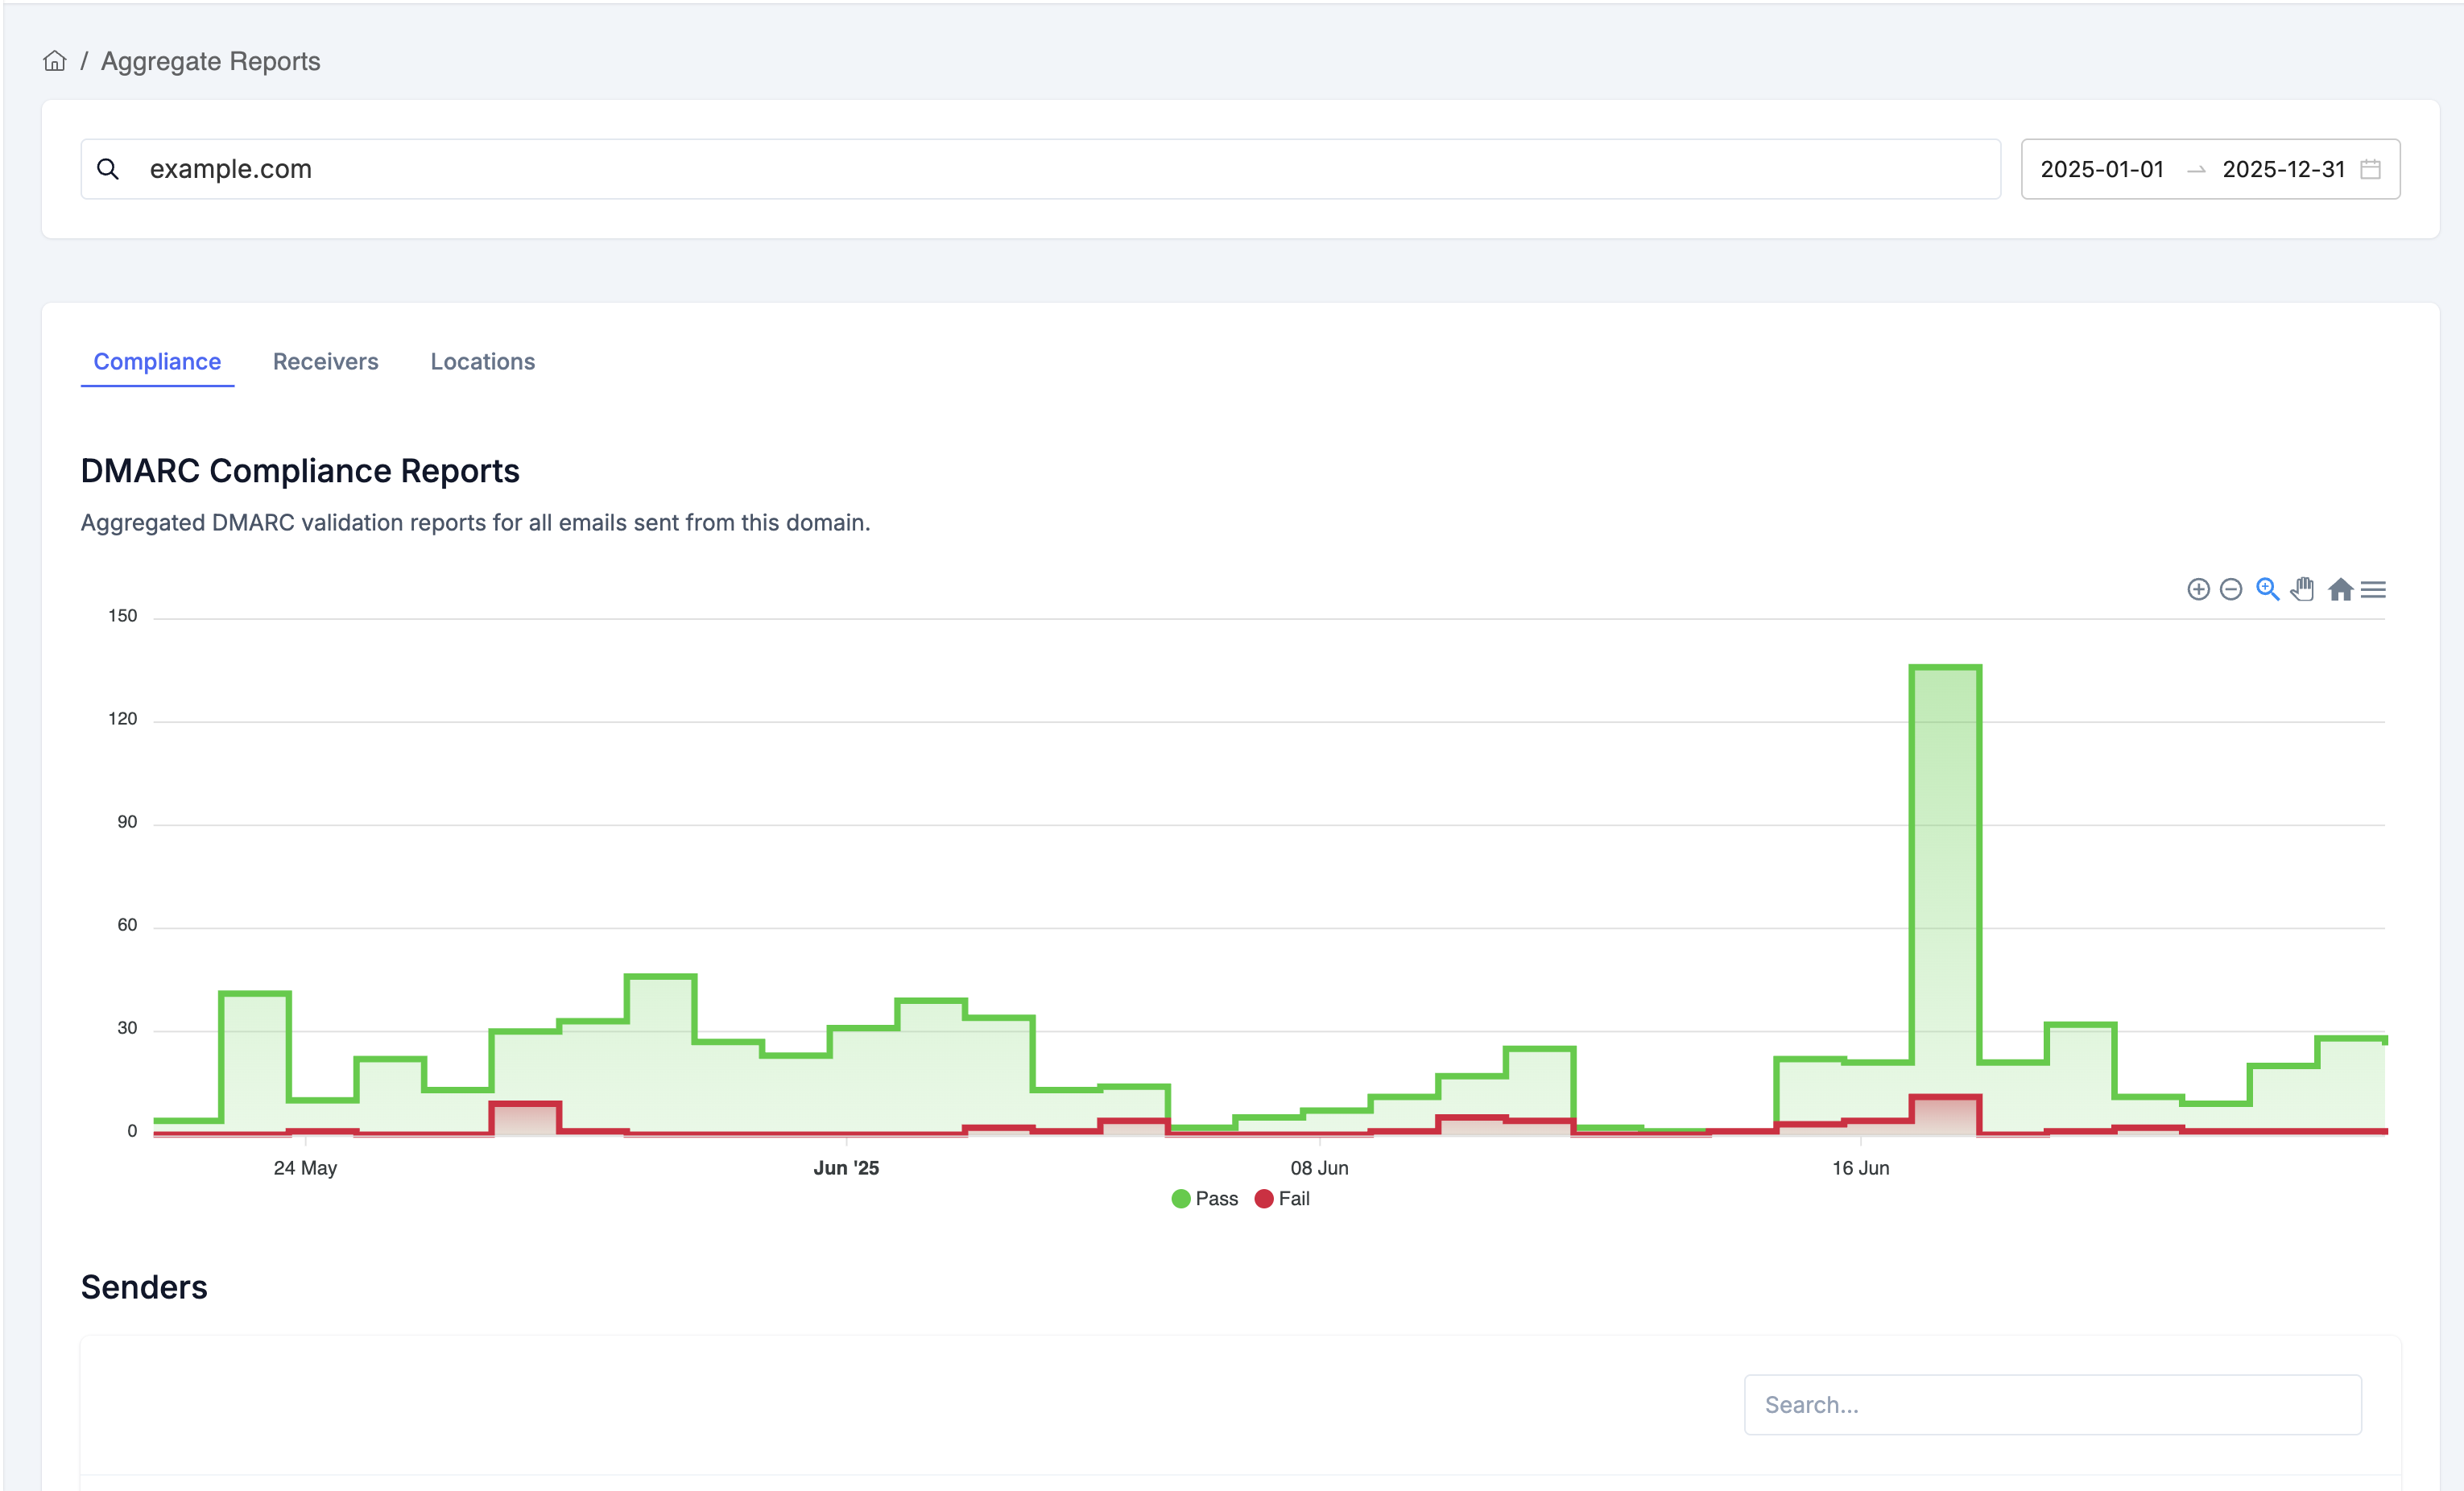
1. Compliance Tab
This is the default view showing DMARC compliance trends and sender details.
DMARC Compliance Chart:
- Area chart with two lines:
- Green line - Emails that passed DMARC
- Red line - Emails that failed DMARC
- Shows daily trends over your selected date range
- Step-line visualization for clear day-to-day comparison
Senders Table:
Below the chart, you'll see a detailed table of all sending sources with these columns:
- ☑️ Checkbox - Select multiple sources for bulk actions
- Source Name - Organization name or "Others" if unknown (e.g., "Google", "Amazon SES", "Mailchimp")
- Type - Source classification (Known, Unknown, Threat, or Unmarked)
- Emails Sent - Total volume from this source
- Compliance - Percentage of emails passing DMARC
- DMARC Fails - Number of emails that failed DMARC
- SPF - SPF pass percentage
- DKIM - DKIM pass percentage
- Action - Button to view detailed source information
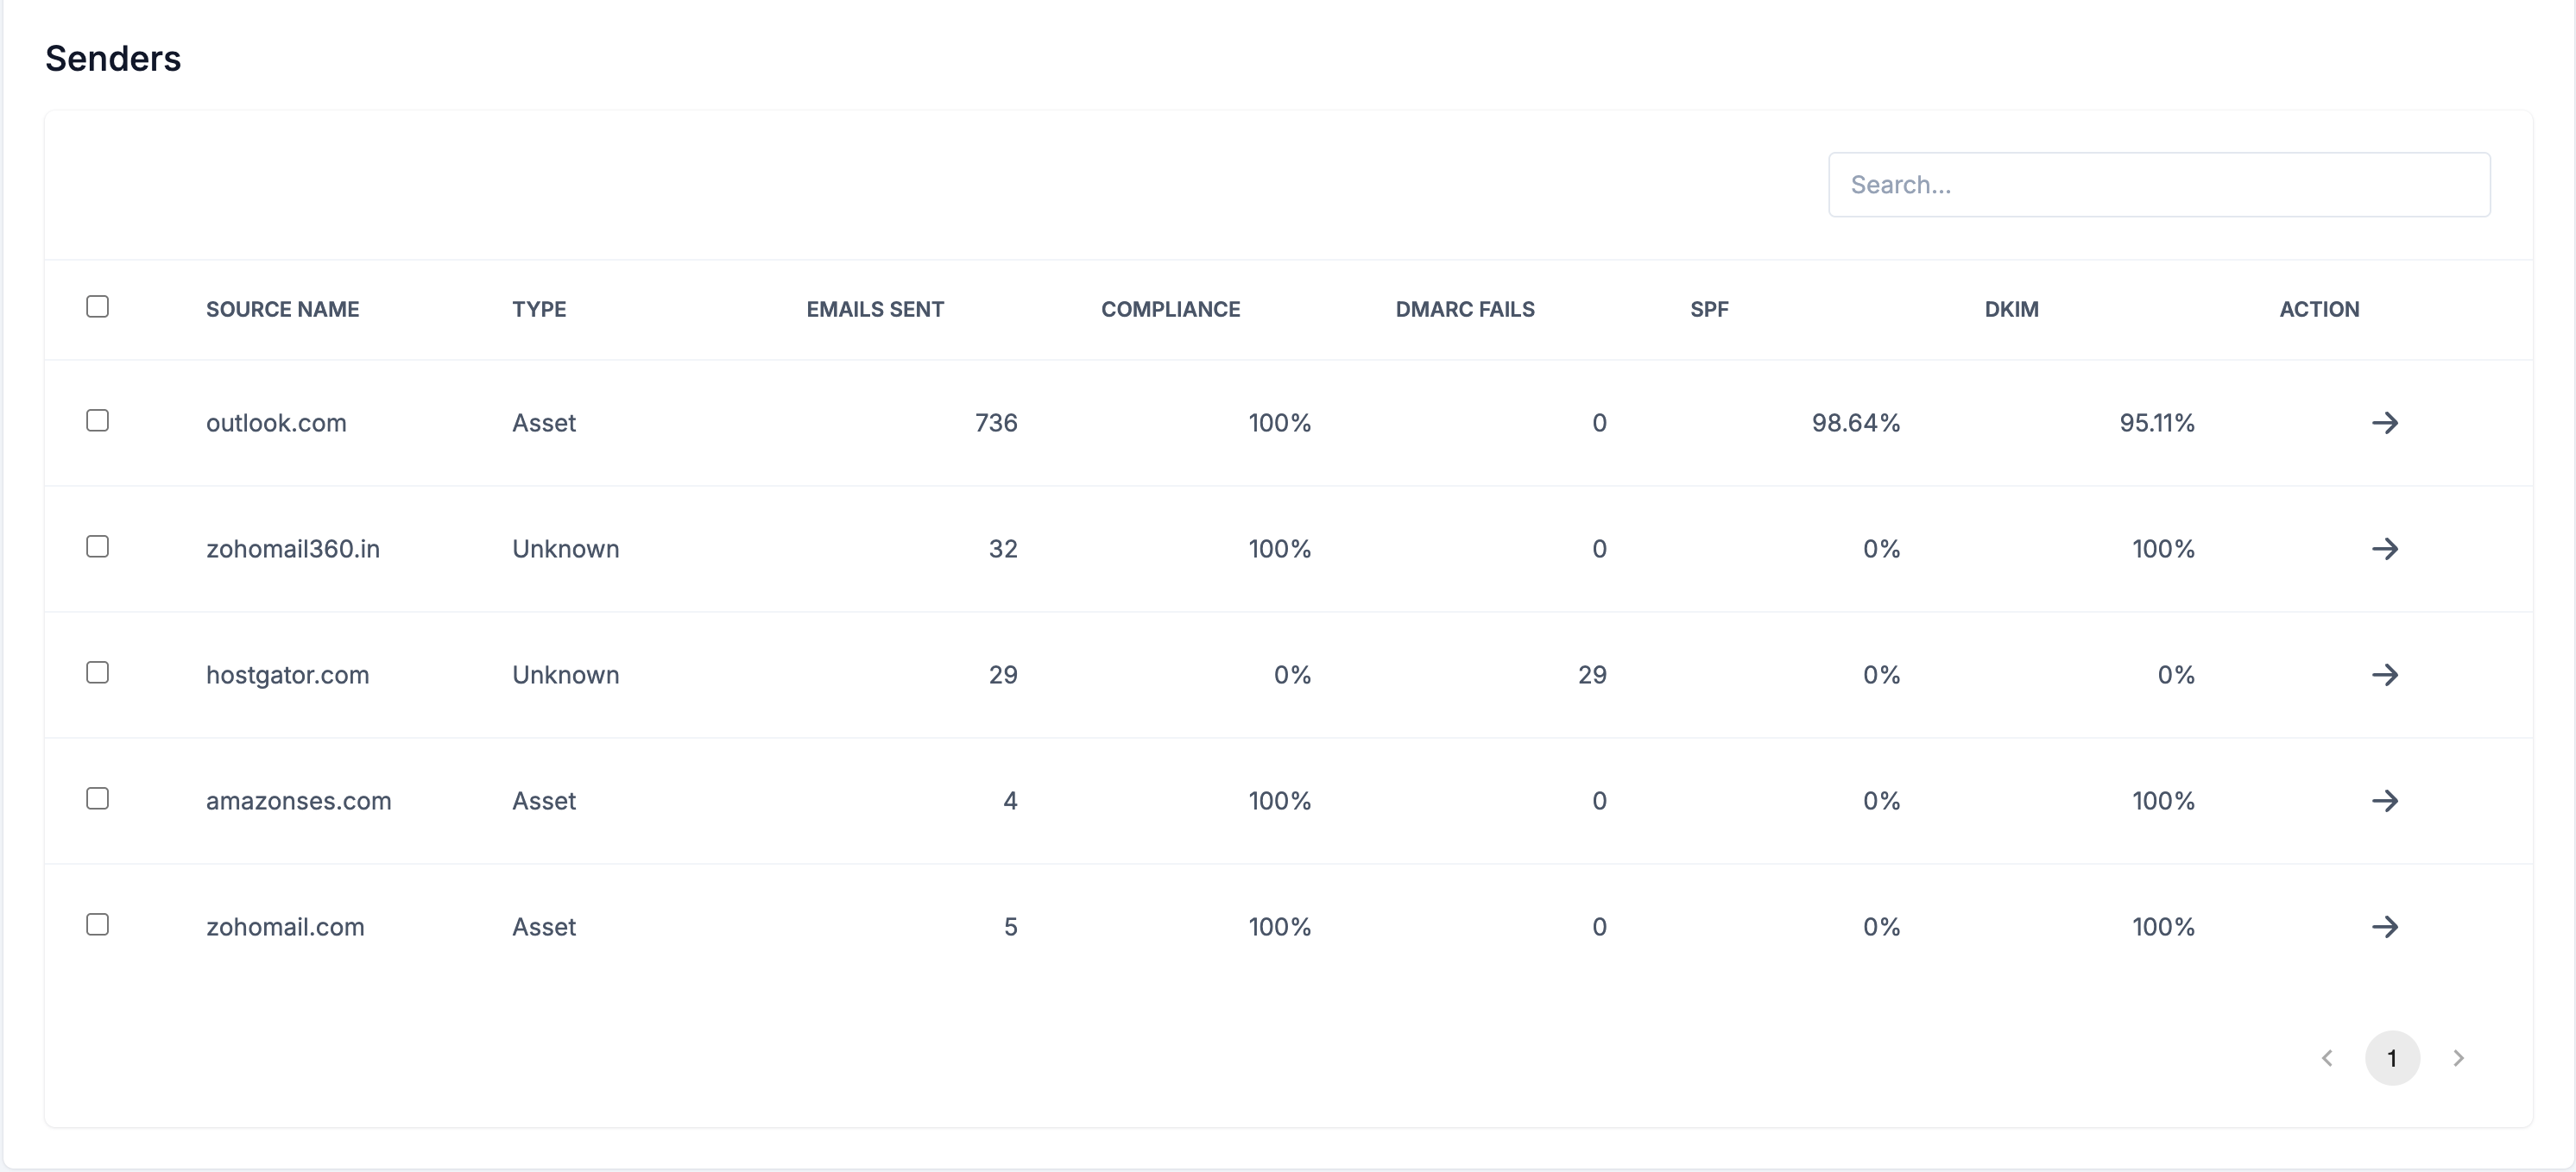
Click any source to view detailed information.
2. Receivers Tab
Shows which email providers (Gmail, Yahoo, Outlook, etc.) received emails from your domain.
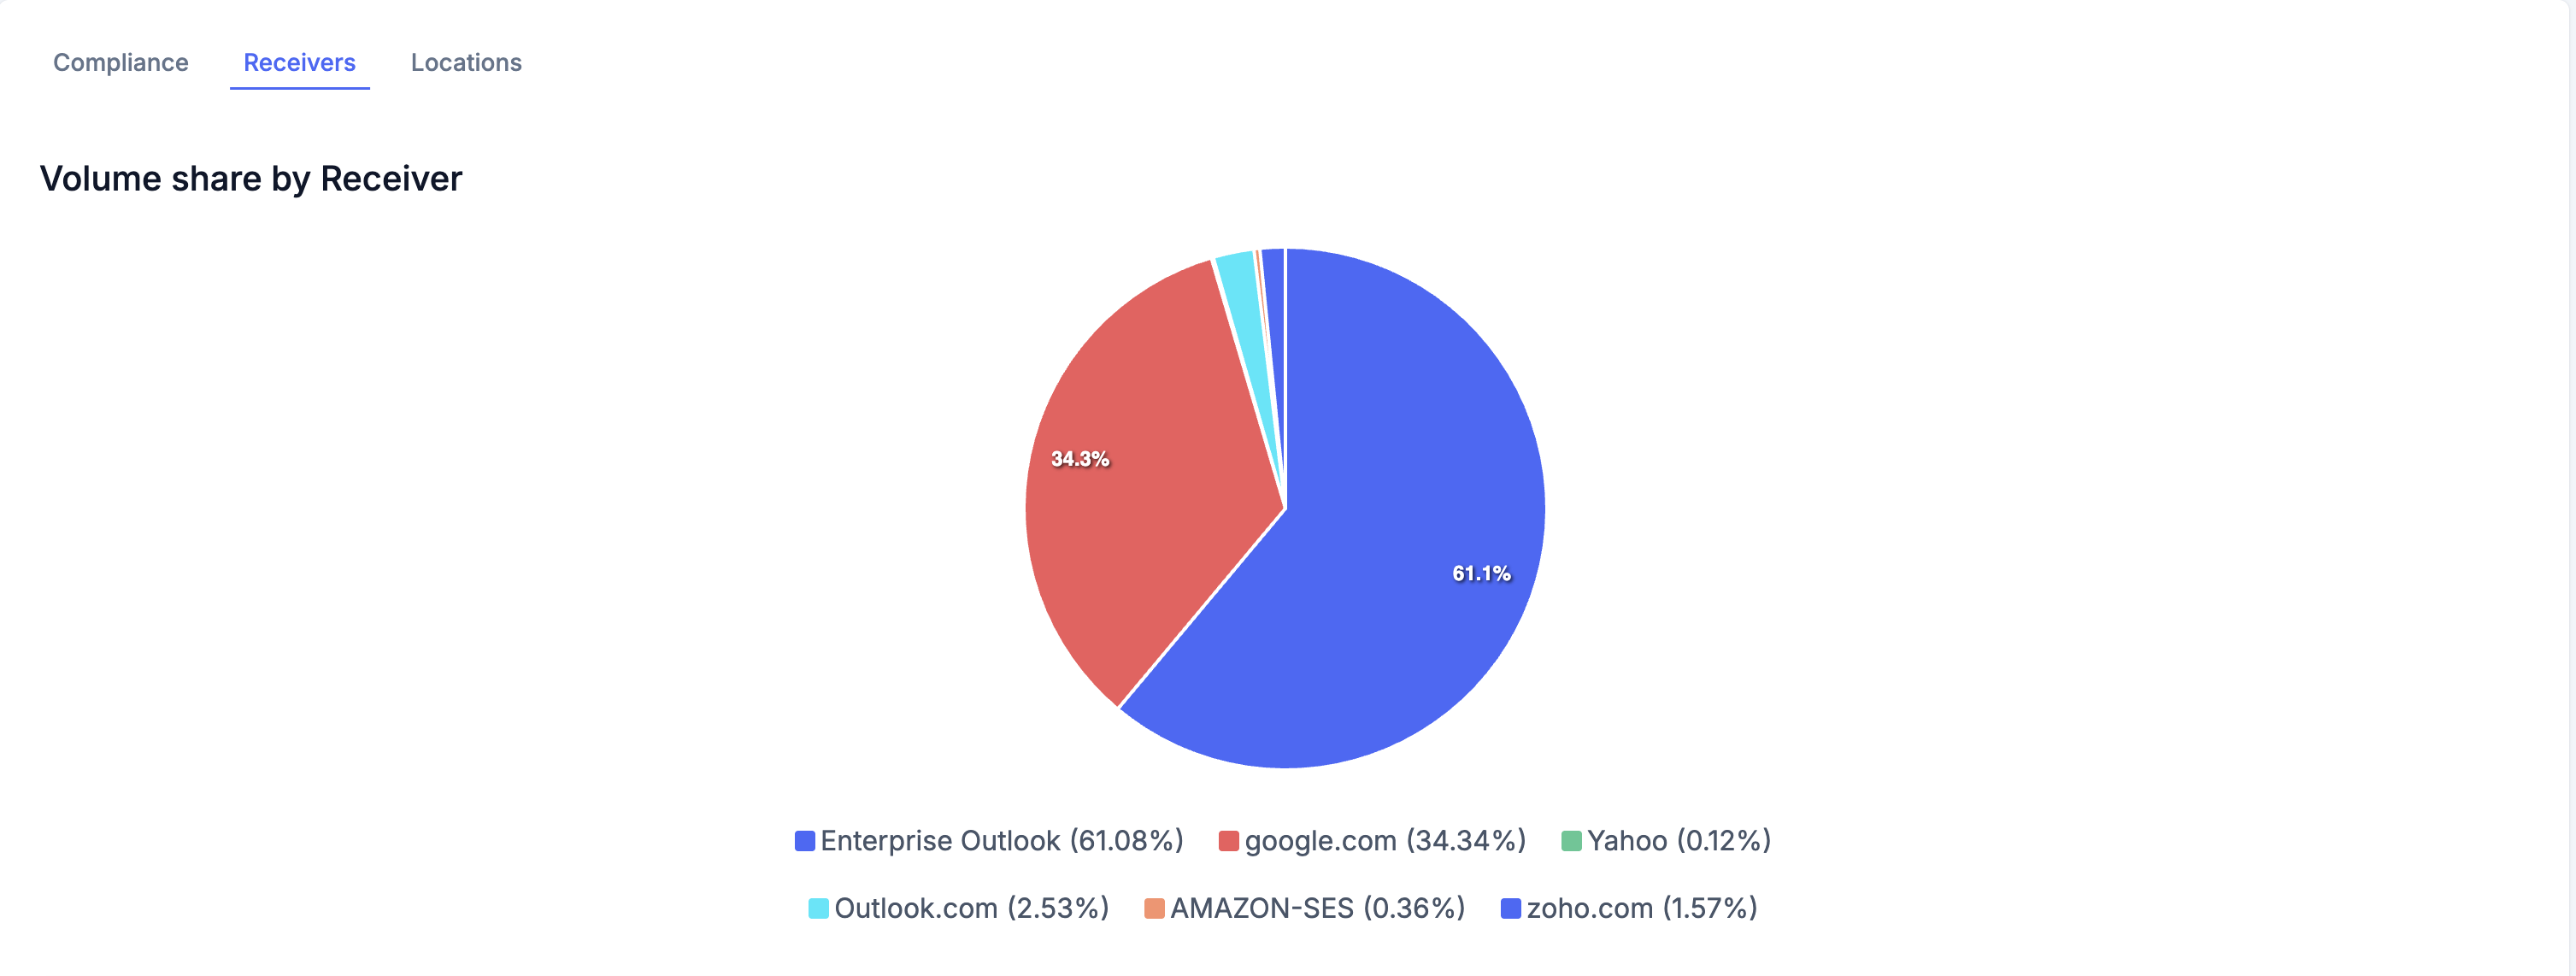
What You'll See:
- Pie chart - Visual breakdown of receiver distribution
- Receivers table with:
- Receiver Name - Email provider (e.g., "Google", "Yahoo", "Microsoft")
- Total Volume - Number of emails delivered to this receiver
3. Locations Tab
Shows the geographic distribution of your email sending sources with a visual heat map.
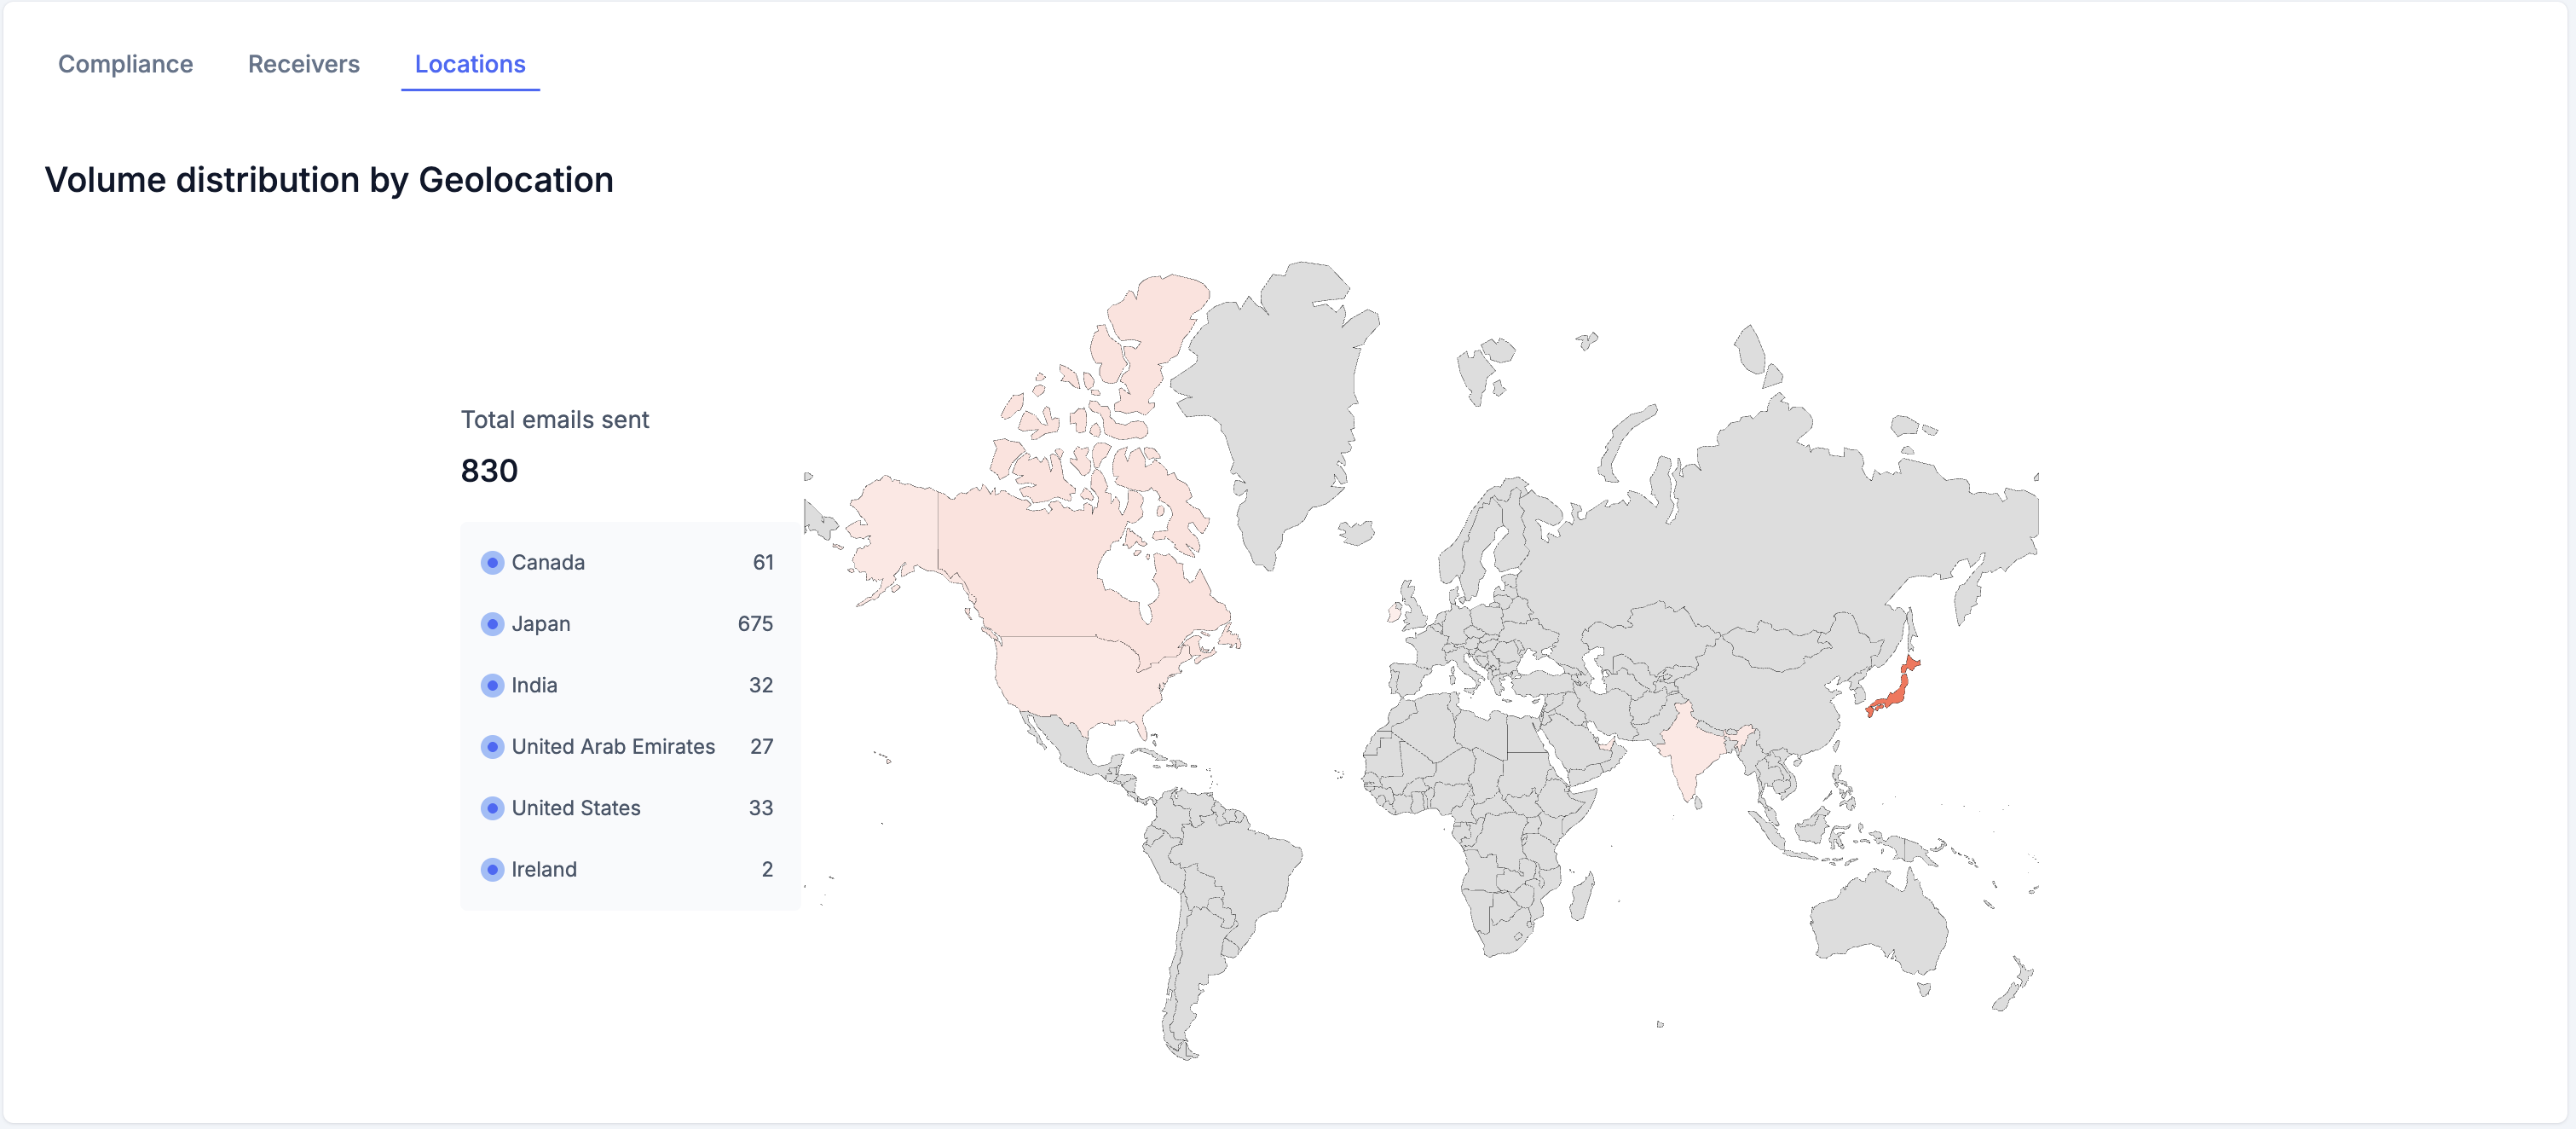
What You'll See:
Left Side - Summary Card:
- Total Emails Sent - Overall count across all locations
- Country List - Shows each country with:
- Country name
- Email volume number
Right Side - Interactive World Map:
- Countries are color-coded using a red heat map scale:
- Dark Red - Highest email volume (top sender location)
- Medium Red - Moderate email volume (second/third highest)
- Light Red - Lower email volume
- Gray - No emails sent from this location
- Provides instant visual identification of your primary sending regions
Why It Matters:
- Spot anomalies - Unexpected locations could indicate spoofing or compromised accounts
- Verify infrastructure - Confirm your email services are sending from expected countries
- Geographic patterns - Understand where your email infrastructure is physically located
- Security monitoring - Dark red countries should match your known providers' locations
Security Tip: If you see dark red coloring in countries where you don't have email infrastructure, investigate immediately in the Compliance tab to identify the sources.
Mark Sources for Better Classification
Properly categorizing sources is essential for the Phases feature and helps identify legitimate vs. malicious senders.
To Mark Sources:
- In the Senders Table, use the checkboxes to select one or more sources
- After selecting, a bulk action menu will appear
- Choose one of these actions:
- Mark as Asset - Legitimate senders (your email providers, marketing tools, CRM systems)
- Mark as Threat - Suspicious or malicious sources that should be blocked
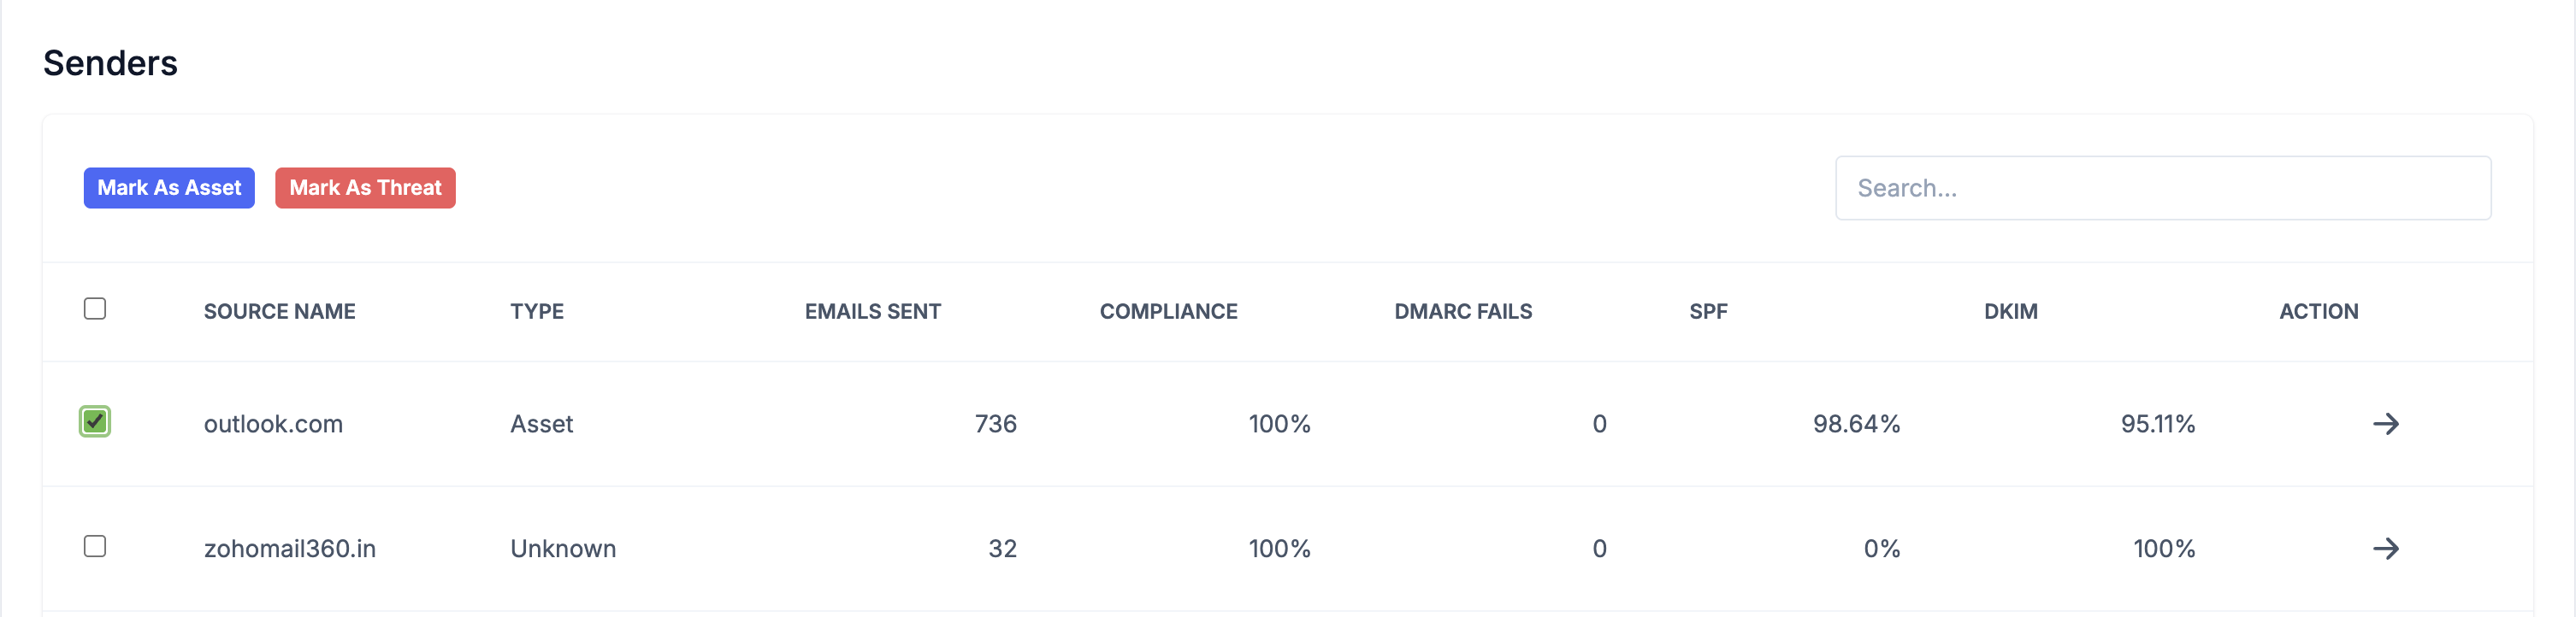
These classifications affect your compliance calculations in the Phases feature
Best Practice: Start by selecting and marking all your obvious legitimate sources as Assets in bulk, then investigate unknowns weekly and mark them appropriately.
Forensic Reports
Forensic reports provide detailed information about individual email authentication failures.
Access Forensic Reports
- Click "DMARC Reports" in the sidebar
- Select "Forensic Reports"
Or from the Domains page:
- Click "View Forensic Reports" in the Actions dropdown for any domain
Filters
At the top, you'll find filters similar to Aggregate Reports:
- Domain Selector - Choose which domain to view forensic reports for
- Date Range Picker - Select the time period
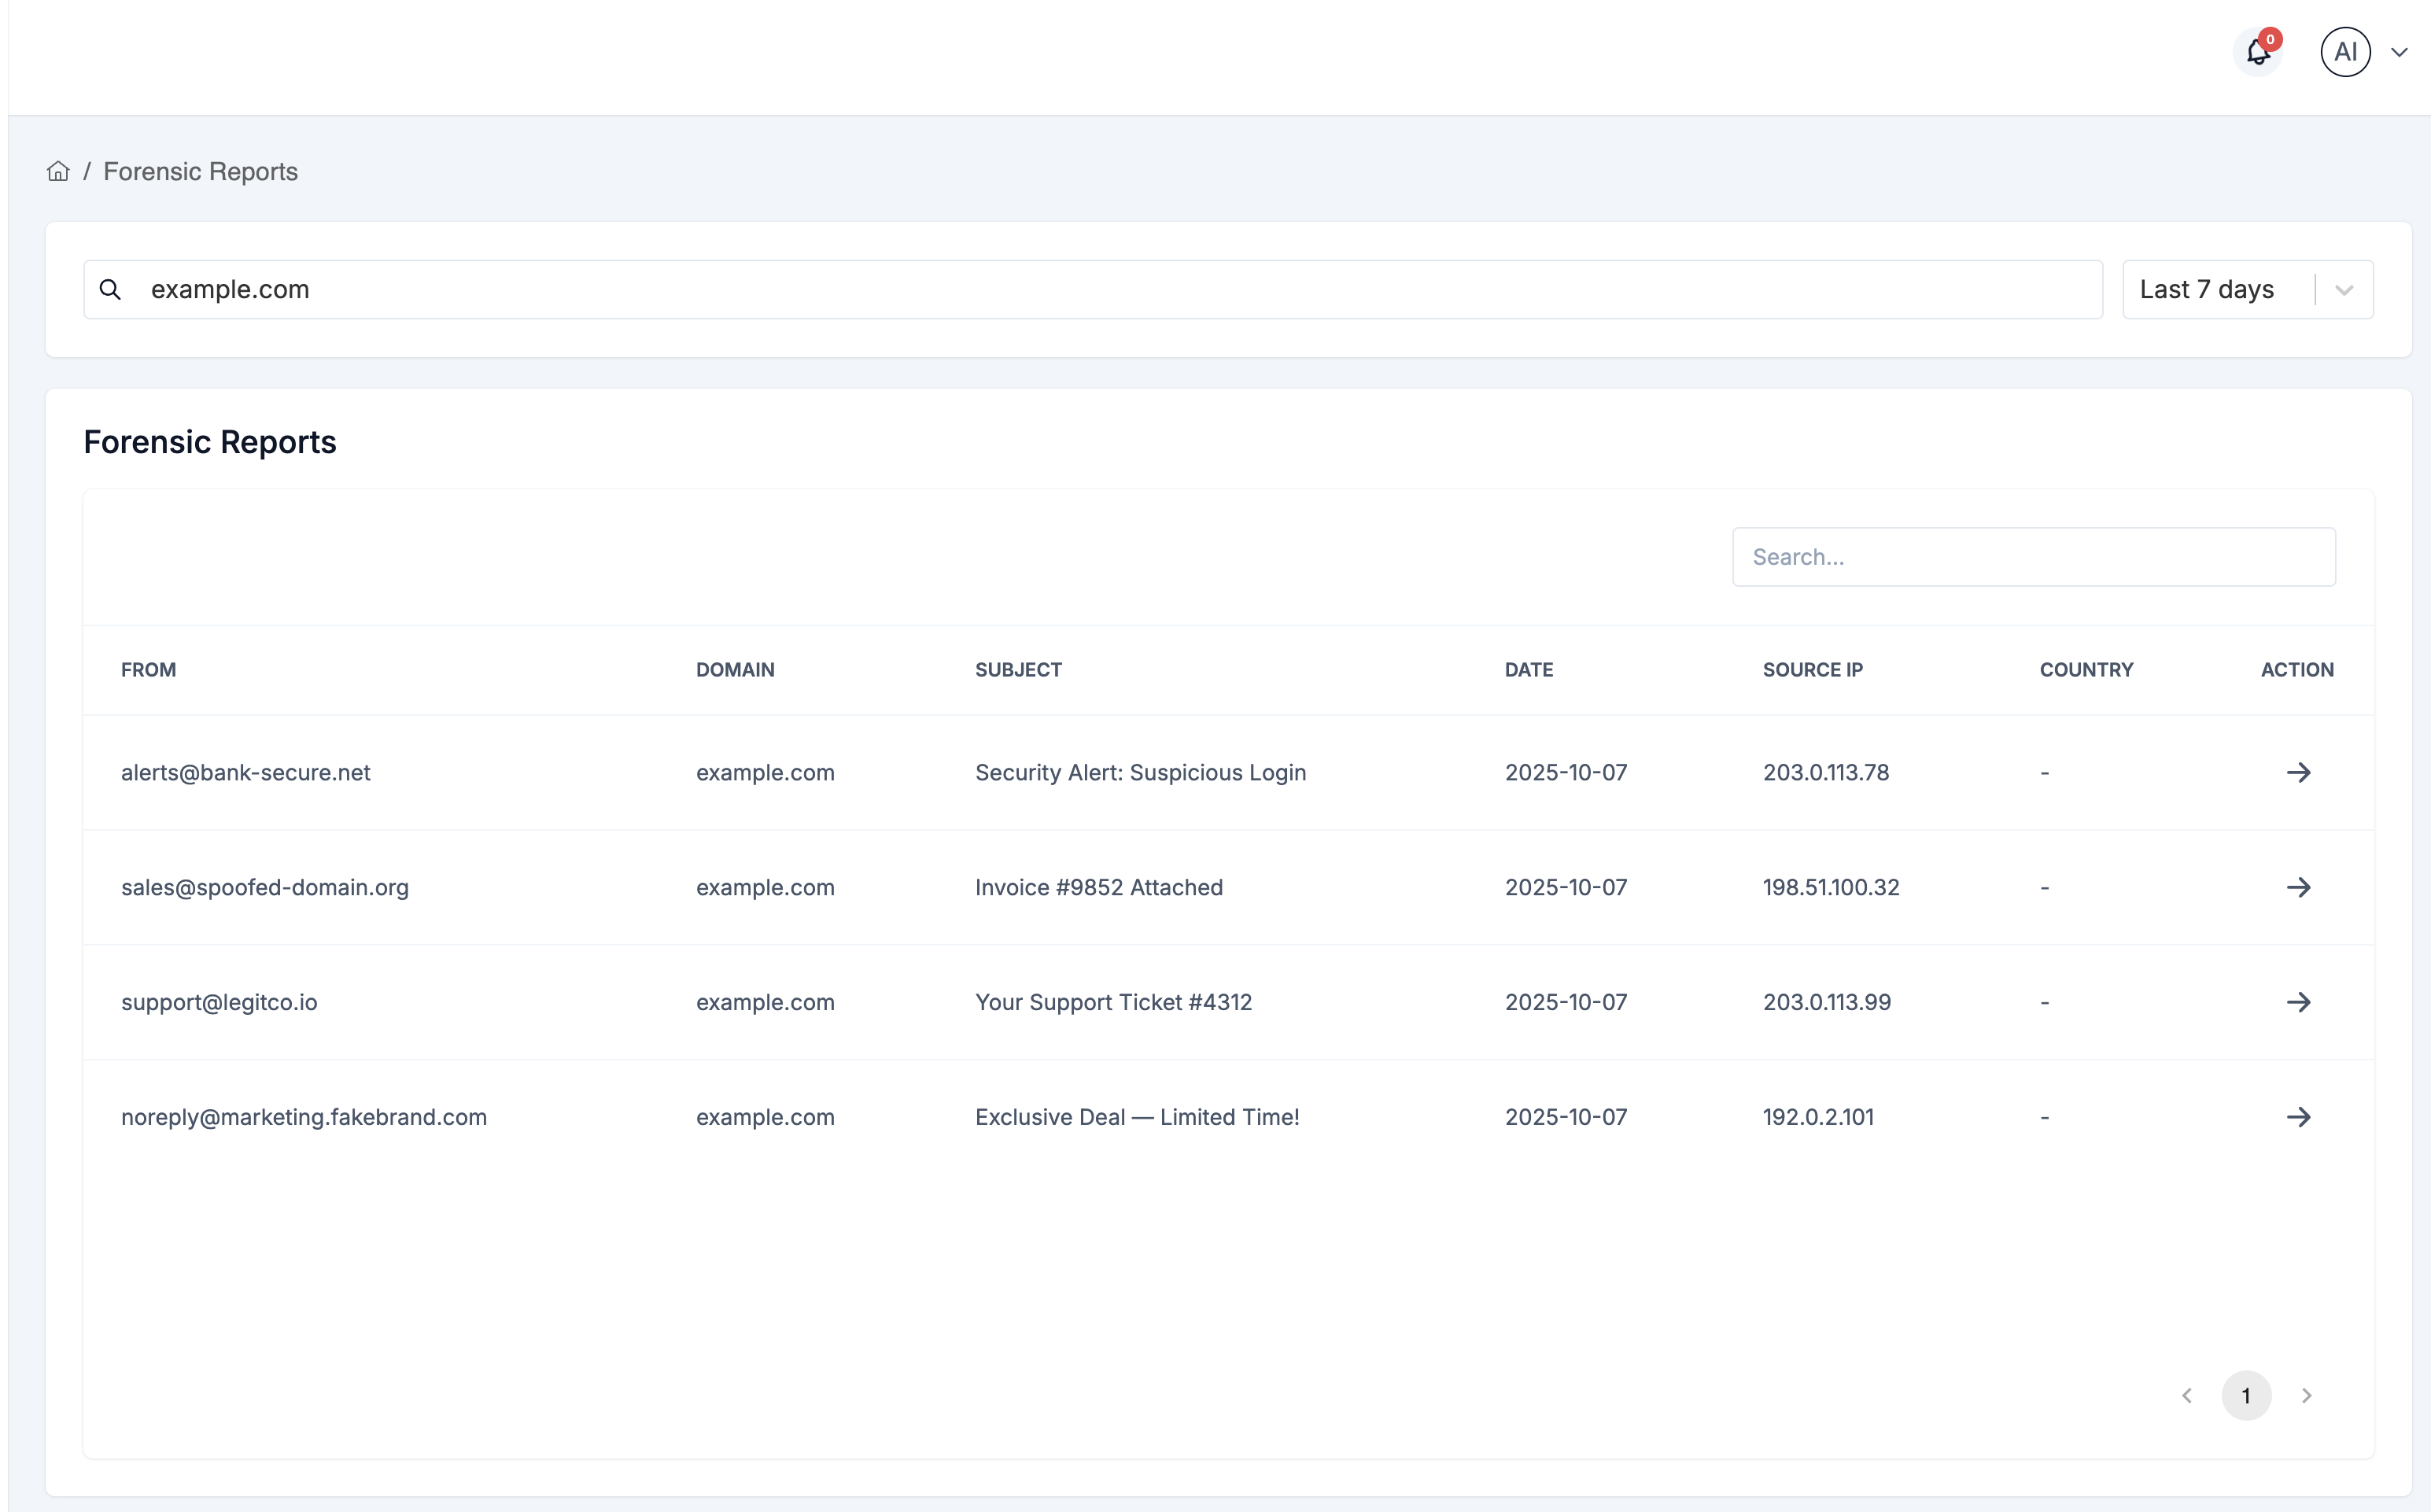
Forensic Reports Table
The main table shows individual failed authentication attempts with these columns:
- From - Original sender email address (who sent the email)
- Domain - Your domain that the email claimed to be from
- Subject - Email subject line
- Date - When the email arrived/failed authentication
- Source IP - IP address of the sending server
- Country - Geographic location of the source IP
- Action - Button to view detailed report
Click any row to view the complete forensic report details.
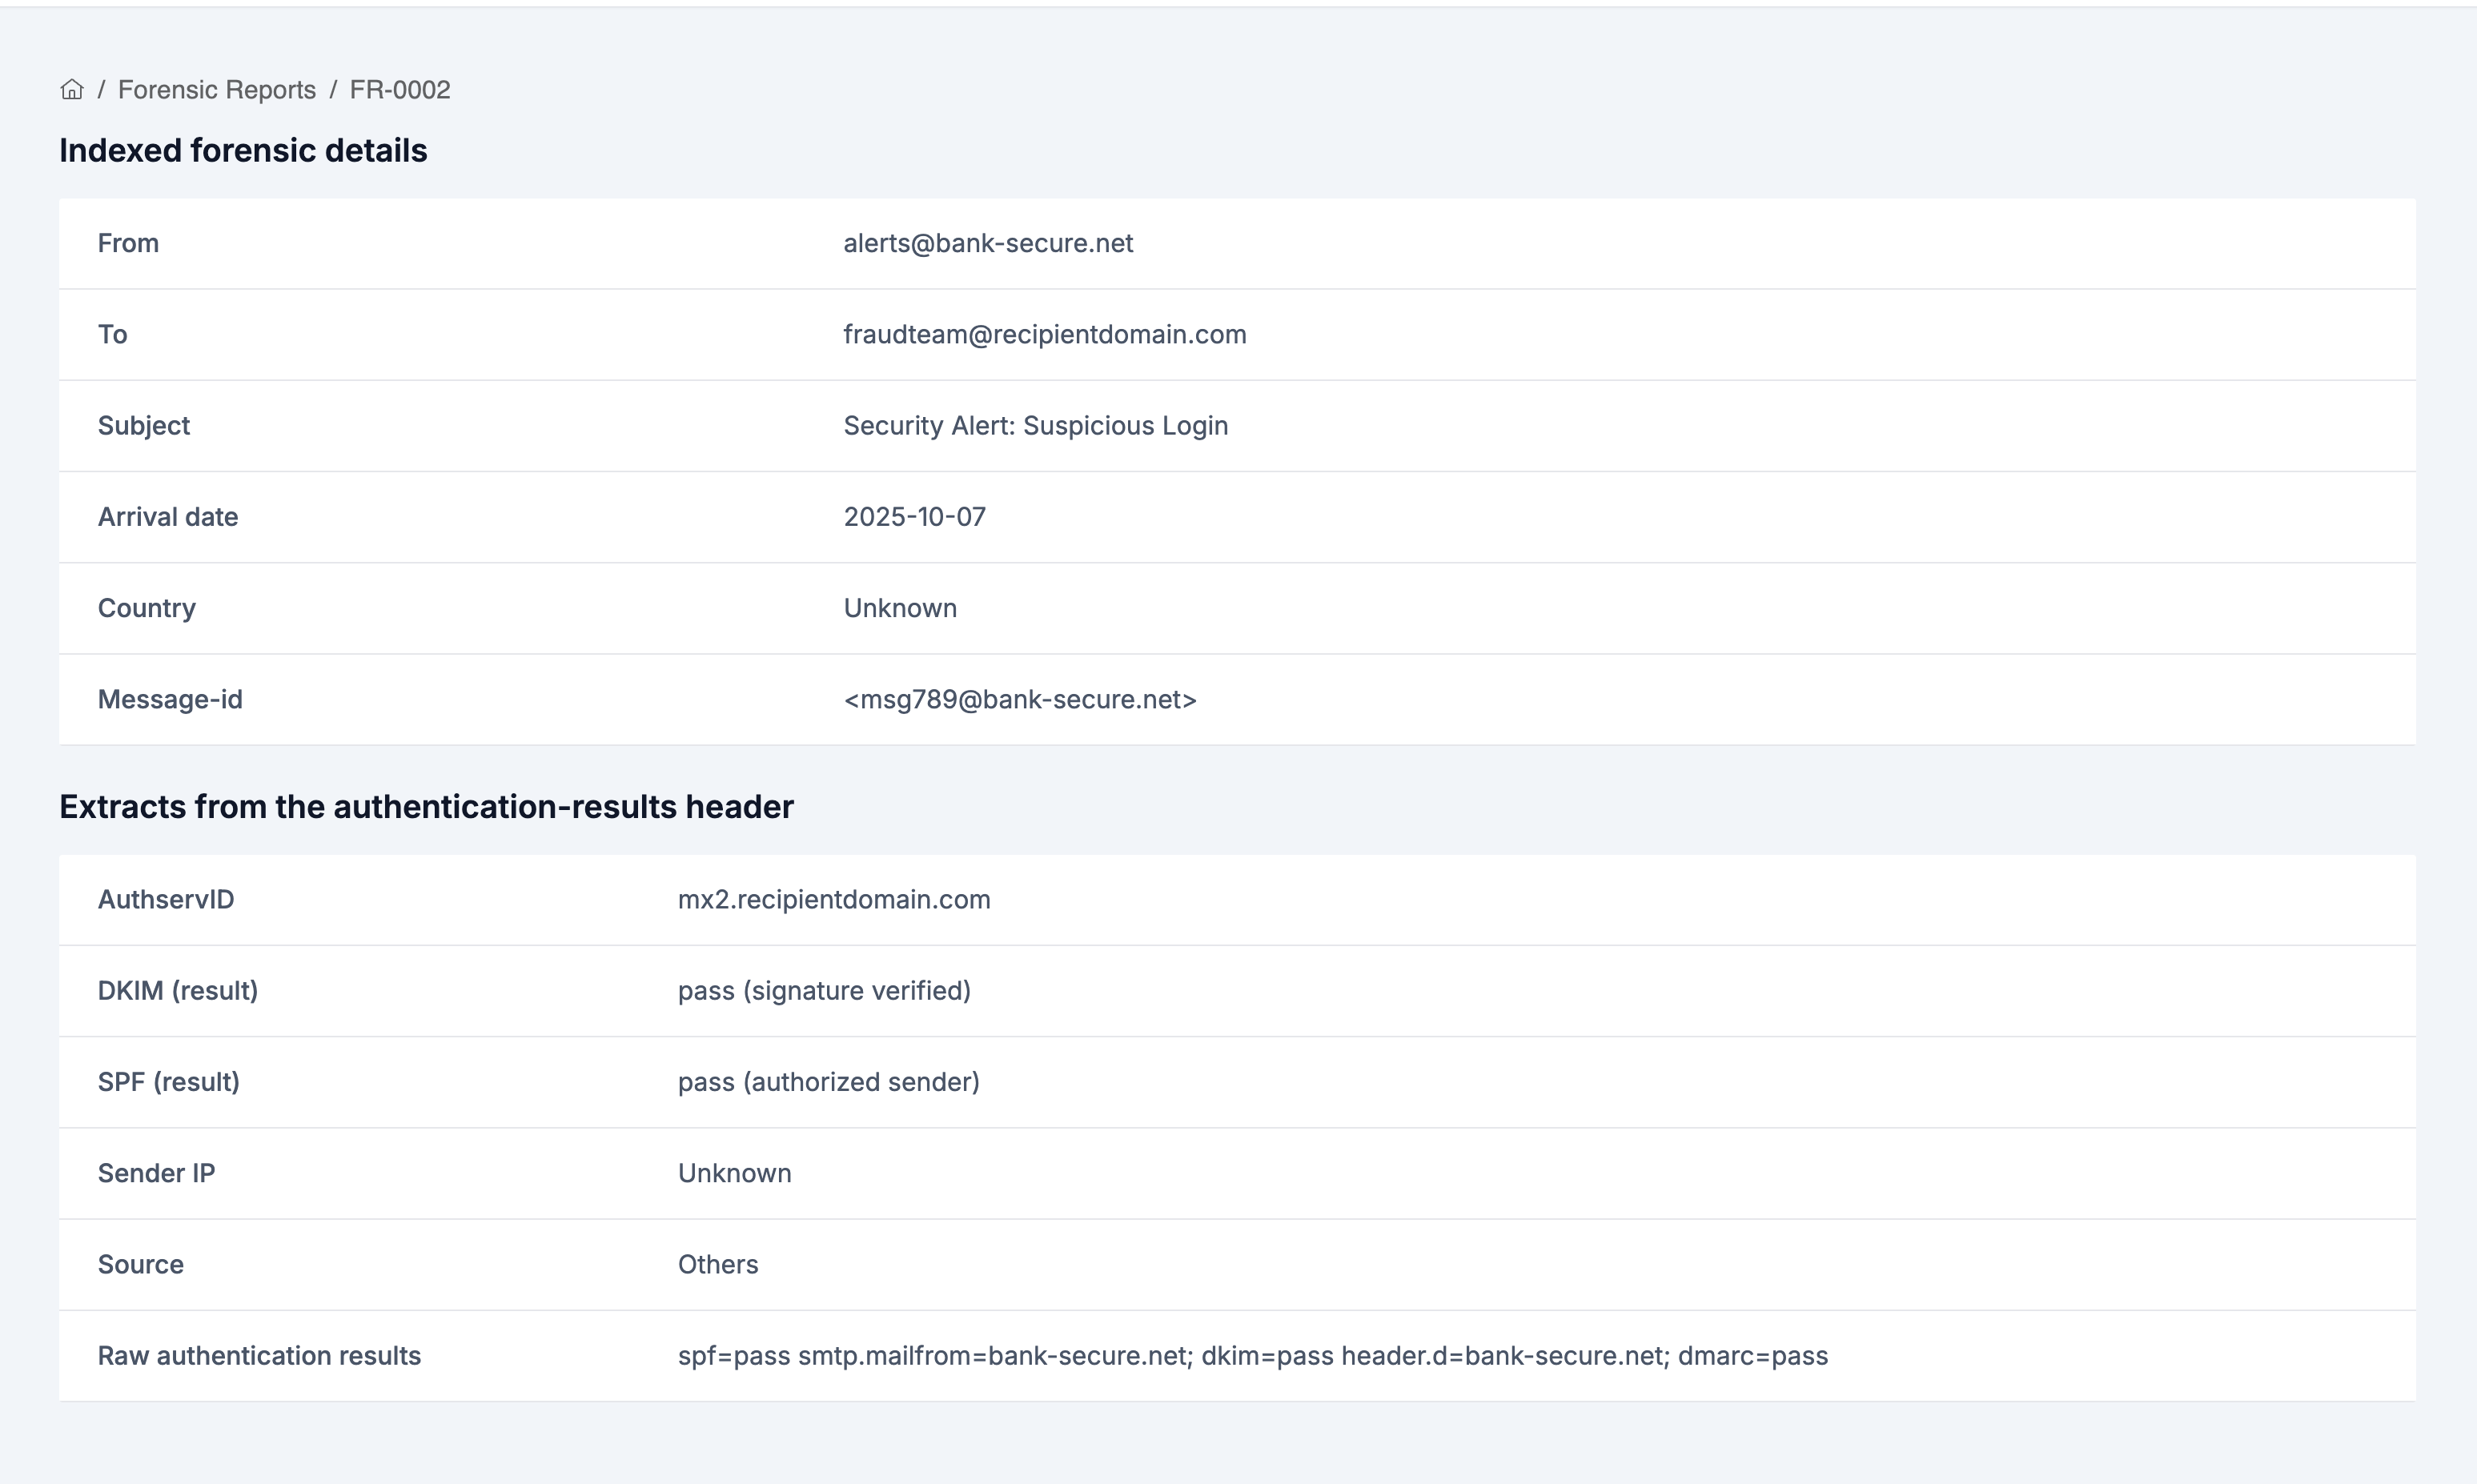
Detailed Forensic Report
When you click on a report, you'll see two sections:
1. Indexed Forensic Details:
- From - Original sender address
- To - Original recipient address
- Subject - Email subject
- Arrival Date - When the email was received
- Country - Source country
- Message-ID - Unique email identifier
2. Authentication Results:
- AuthservID - Authentication service identifier
- DKIM (result) - DKIM authentication result (pass/fail/none)
- SPF (result) - SPF authentication result (pass/fail/none)
- Sender IP - Source IP address
- Source - Source organization name (e.g., "Google", "Others")
- Raw Authentication Results - Complete authentication header data
Note: Forensic reports arrive within a couple of hours of email failures, while aggregate reports take ~24 hours. However, not all email providers send forensic reports due to privacy concerns.
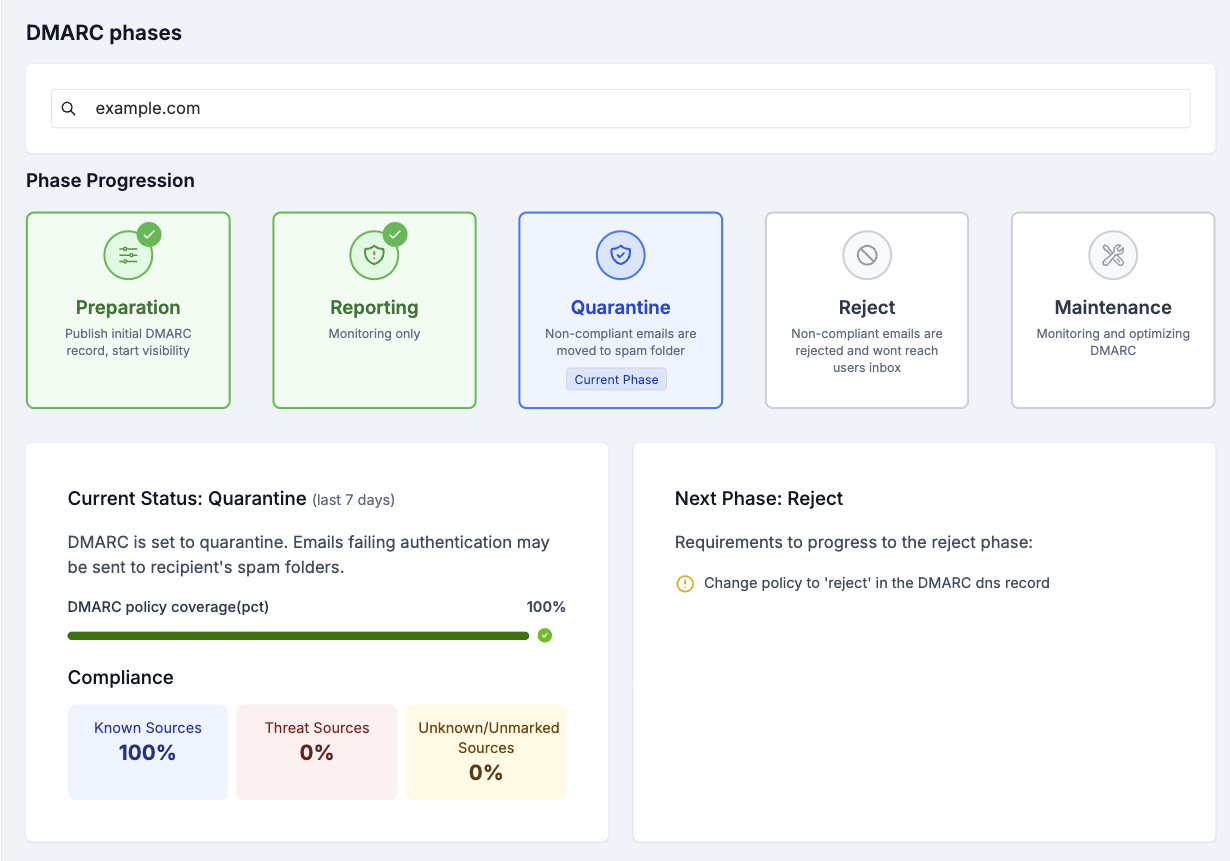
Step 5: Use Phases for Policy Progression
What are Phases?
The Phases feature guides you through safely implementing DMARC enforcement in 5 stages:
- Preparation - Initial setup and monitoring
- Reporting - Gathering data with
p=none - Quarantine - Moving suspicious emails to spam with
p=quarantine - Reject - Blocking unauthorized emails with
p=reject - Maintenance - Ongoing monitoring and optimization
Access Phases
- Click "Phases" in the sidebar
- View your current phase for each domain
Understanding Phase Information
Each phase shows:
- Current Phase - Which stage you're in
- Compliance Rates - Broken down by:
- Known Sources - Legitimate senders you've marked
- Unknown/Unmarked Sources - Senders not yet categorized
- Threat Sources - Identified malicious senders
- Next Phase Card - Shows:
- Requirements to move to the next phase
- Target compliance percentage needed
- Policy changes required
- Actions needed (e.g., "Mark unknown sources in Aggregate Reports")
Progressing Through Phases
To advance to the next phase:
- Achieve the required compliance rate
- Mark sources appropriately in Aggregate Reports
- Update your DMARC policy if needed
- Monitor for any issues
Best Practice: Spend at least 1-2 weeks in each phase to ensure all legitimate sources are identified. Note: Phases compliance checks are based on your DMARC data from the last 7 days (last week), so your current phase and recommendations reflect your recent sending and authentication behavior.
Step 6: Digital Forensics
Sequack includes powerful email forensics capabilities to analyze suspicious emails.
How to Use Digital Forensics
-
Forward suspicious emails to your dedicated Sequack forensics mailbox:
- Address format:
uniqid@forensic.outpost.sequack.com- Example:
12345@forensic.outpost.sequack.comor67890@ae-forensic.outpost.sequack.com
- Example:
- You can find your unique forensic address on the Digital Forensics page in the app.
- Address format:
-
Or upload .eml or .msg files directly:
- Use the upload button on the Digital Forensics page to submit email files for analysis.
-
Wait a few minutes for analysis to complete.
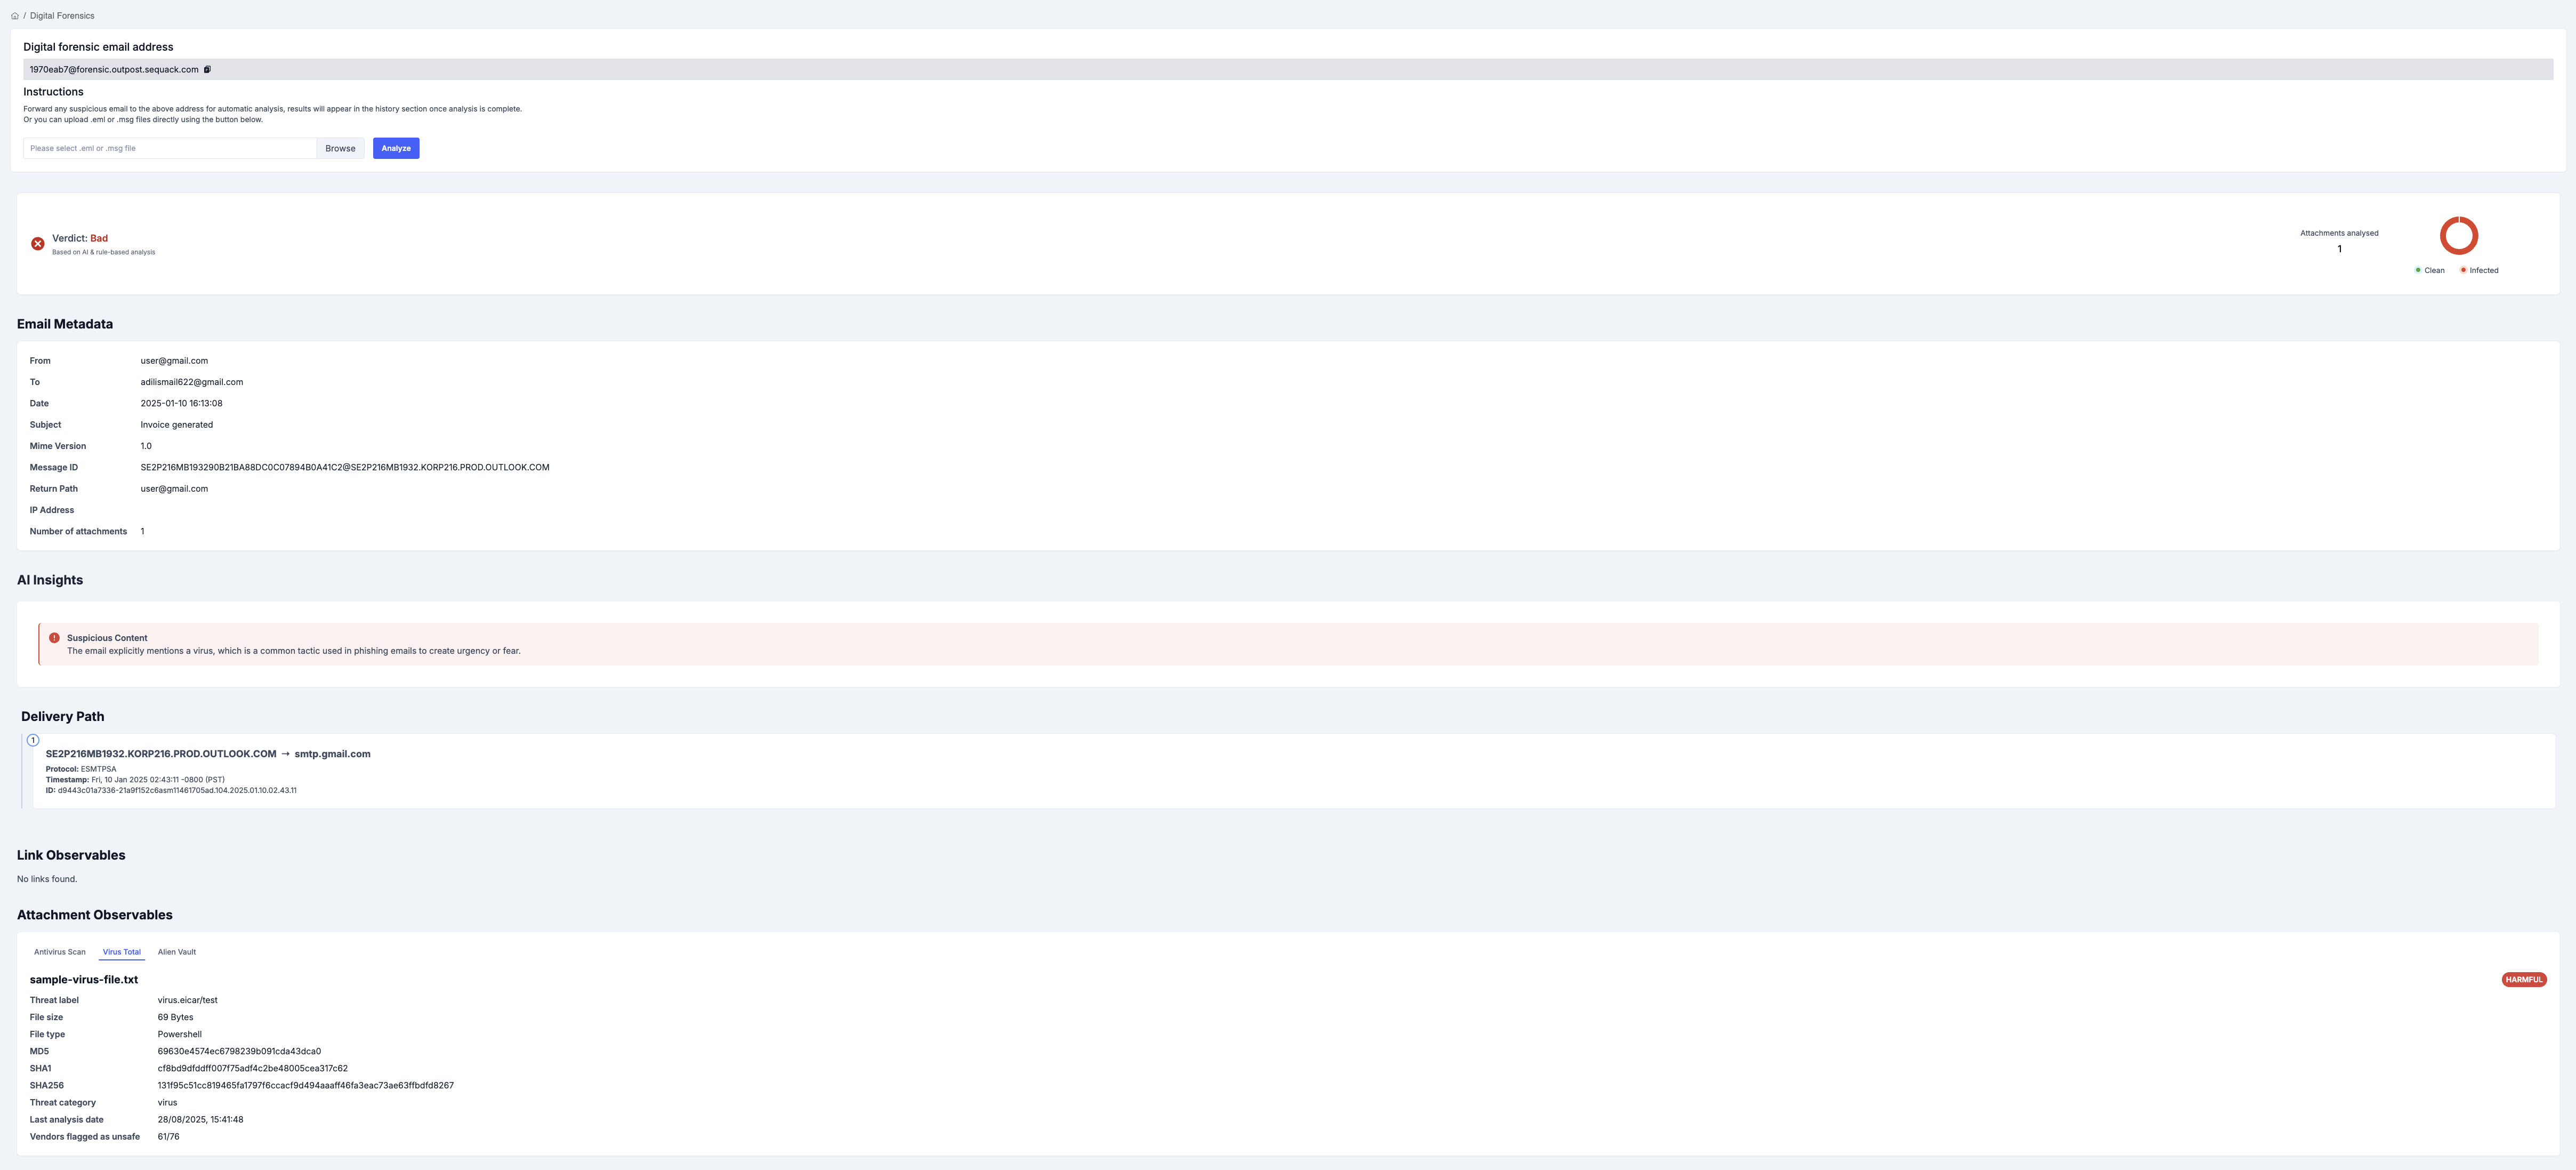
-
View the forensic report, which includes:
- Header Analysis — Email routing hops and authentication results
- Subject & Body — Email content analysis
- AI Analysis — Machine learning-based threat assessment
- Attachment Observables — All attachments are scanned and analyzed:
- Antivirus Scan Result — Shows if any attachment is infected
- AlienVault — AlienVault threat intelligence verdict for each attachment
- VirusTotal — Virustotal verdict for each attachment
- Link Observables — All links extracted from the email:
- VirusTotal Result — Virustotal threat verdict for each link
- AlienVault OTX Result — AlienVault threat verdict for each link
Tip: For the most comprehensive analysis, go to Settings → Security and input your API keys for AlienVault and VirusTotal. This enables advanced threat intelligence for both attachments and links in your forensic reports.
Understanding Results
The forensics report will show:
- 🟢 Safe — No threats detected
- 🟡 Suspicious — Potential indicators of phishing/spam
- 🔴 Malicious — Confirmed threats detected
Note: Configure your VirusTotal and AlienVault API keys in Settings → Security for enhanced analysis.
Step 7: Security Tools
Sequack provides a suite of built-in tools for in-depth email security analysis. Each tool is designed with a user-friendly interface and actionable results.
Tools Overview
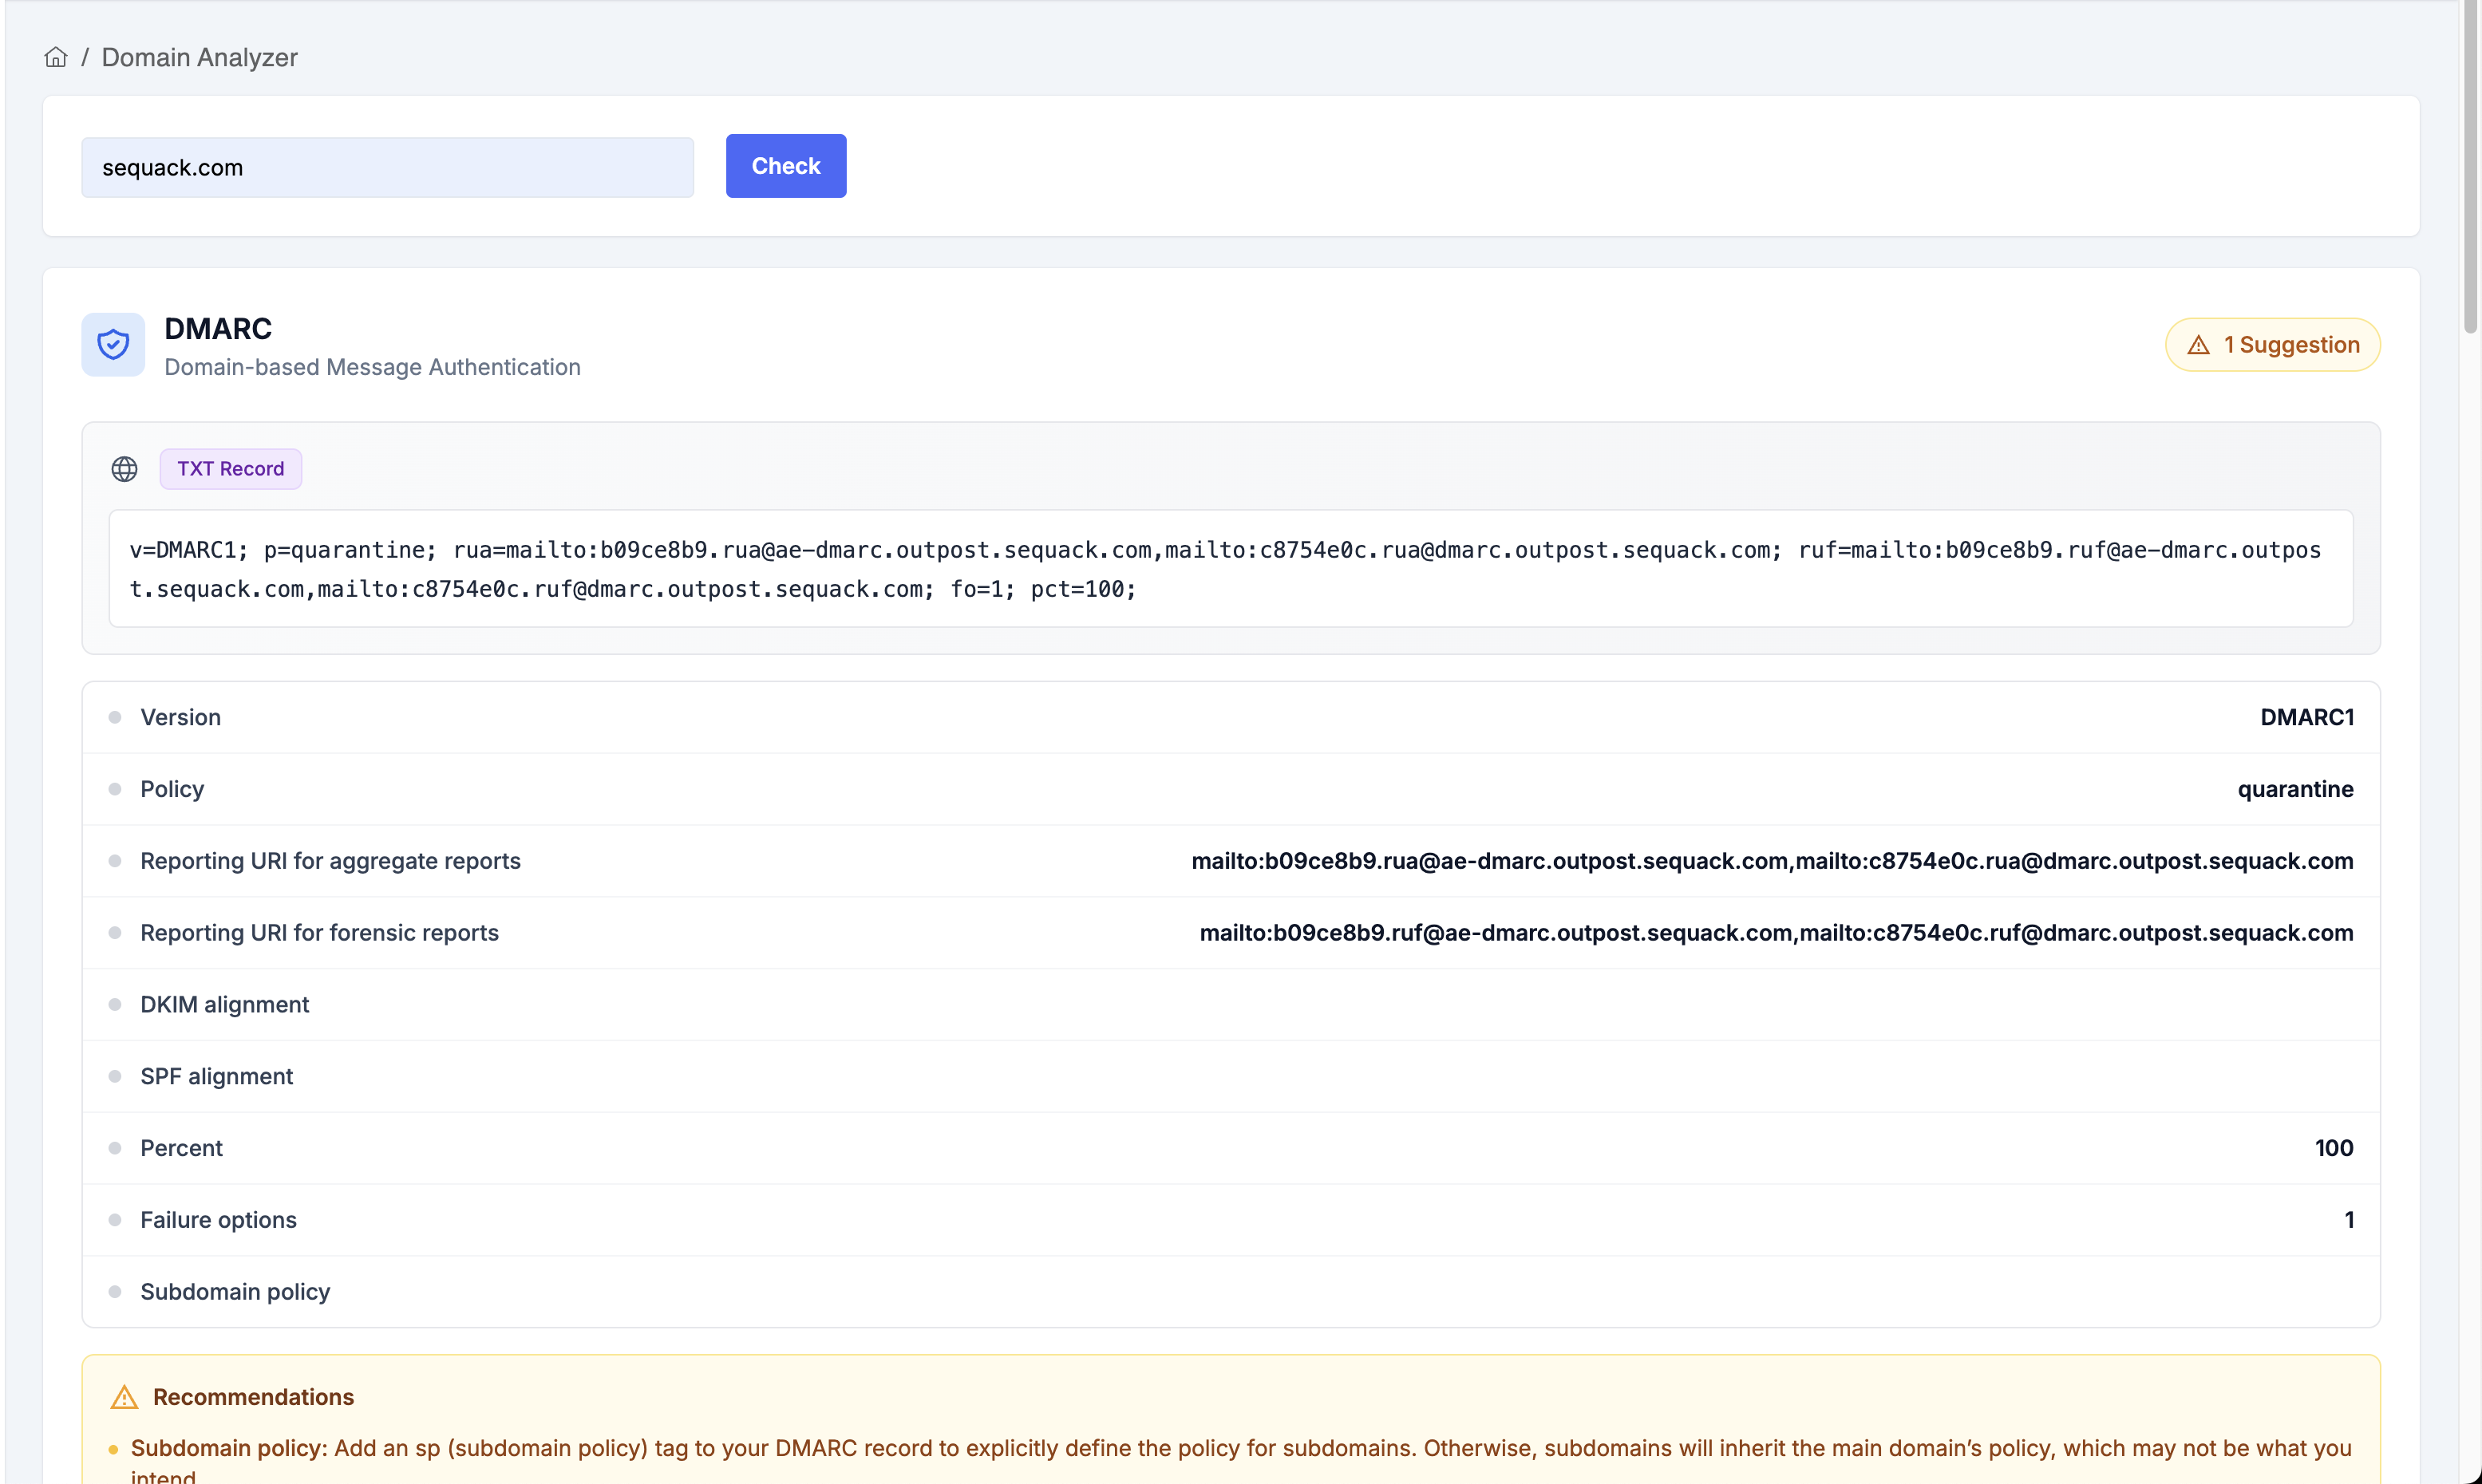
Domain Analyzer
-
Purpose: Instantly check your domain’s DMARC, SPF, DKIM, and BIMI records in one place.
-
How it works:
- Enter your domain name (e.g.,
yourcompany.com). - Click "Check".
- The tool fetches and displays:
- DMARC Record: Full TXT record, policy, reporting URIs, alignment, percent, subdomain policy, and failure options. Errors and suggestions are shown if issues are detected.
- SPF Record: Full TXT record, total lookups, void lookups, and warnings if limits are exceeded.
- DKIM Record(s): All published selectors are shown in tabs, with key details (algorithm, length, public key, flags, notes, granularity).
- BIMI Record: TXT record, SVG logo preview (light/dark), VMC certificate details, and DMARC compliance status.
- Each section highlights errors, warnings, and actionable suggestions.
- Enter your domain name (e.g.,
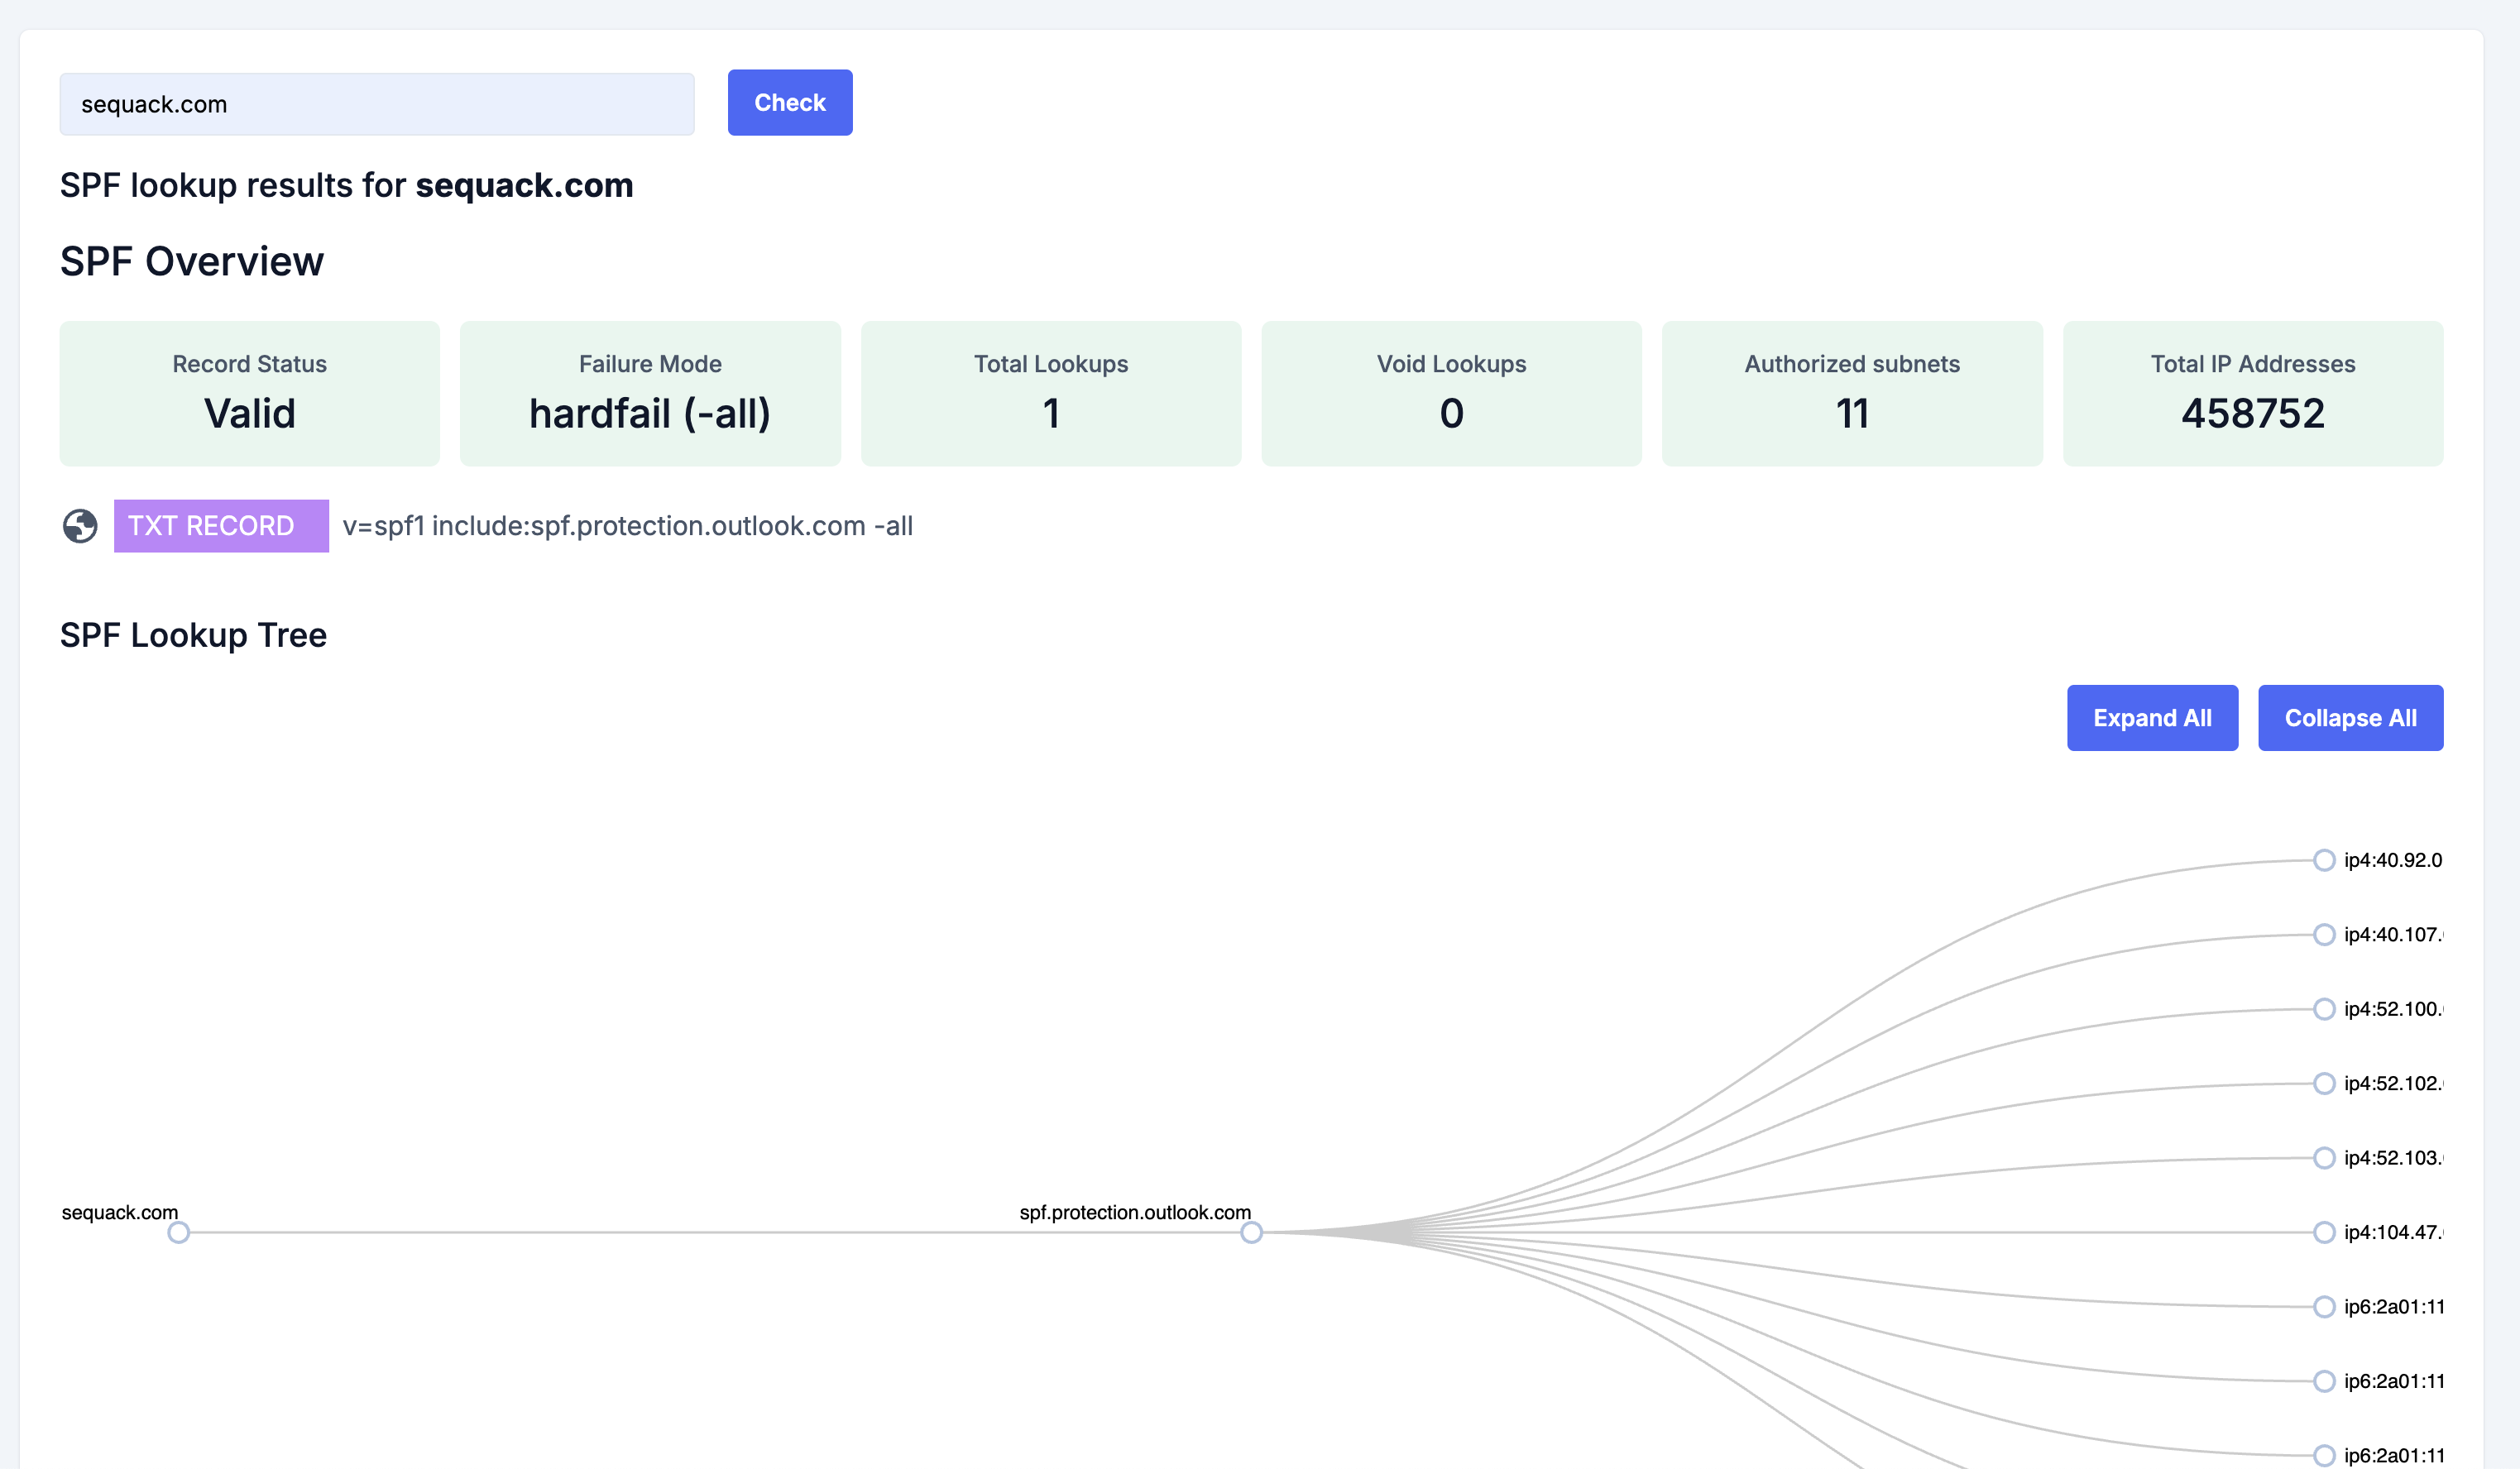
SPF Checker
-
Purpose: Deeply analyze your SPF record for a domain, visualize lookup chains, and catch misconfigurations.
-
How it works:
- Enter your domain name.
- Click "Check".
- The tool displays:
- SPF Overview: Record status (valid/invalid), failure mode, total lookups, void lookups, authorized subnets, and total IP addresses.
- TXT Record: The exact SPF record found in DNS.
- SPF Lookup Tree: Interactive tree visualization of all includes, mechanisms, and IPs resolved by your SPF record. Expand/collapse all nodes for clarity.
- If no SPF record is found, a clear message is shown.
Investigate
-
Purpose: Investigate emails sent to your organization’s dedicated security inbox for authentication and compliance.
-
How it works:
- Find your unique investigation address at the top of the Investigate page (e.g.,
uniqid@investigate.sequack.com). - Send a test or suspicious email from any service to this address.
- The email will appear in the Investigates table below, showing:
- Compliance: Whether DMARC passed (Compliant/Non Compliant)
- From Address
- Subject
- Date
- Action: View full details
- Use the Refresh button to update results. Click the action button to see detailed analysis for each email.
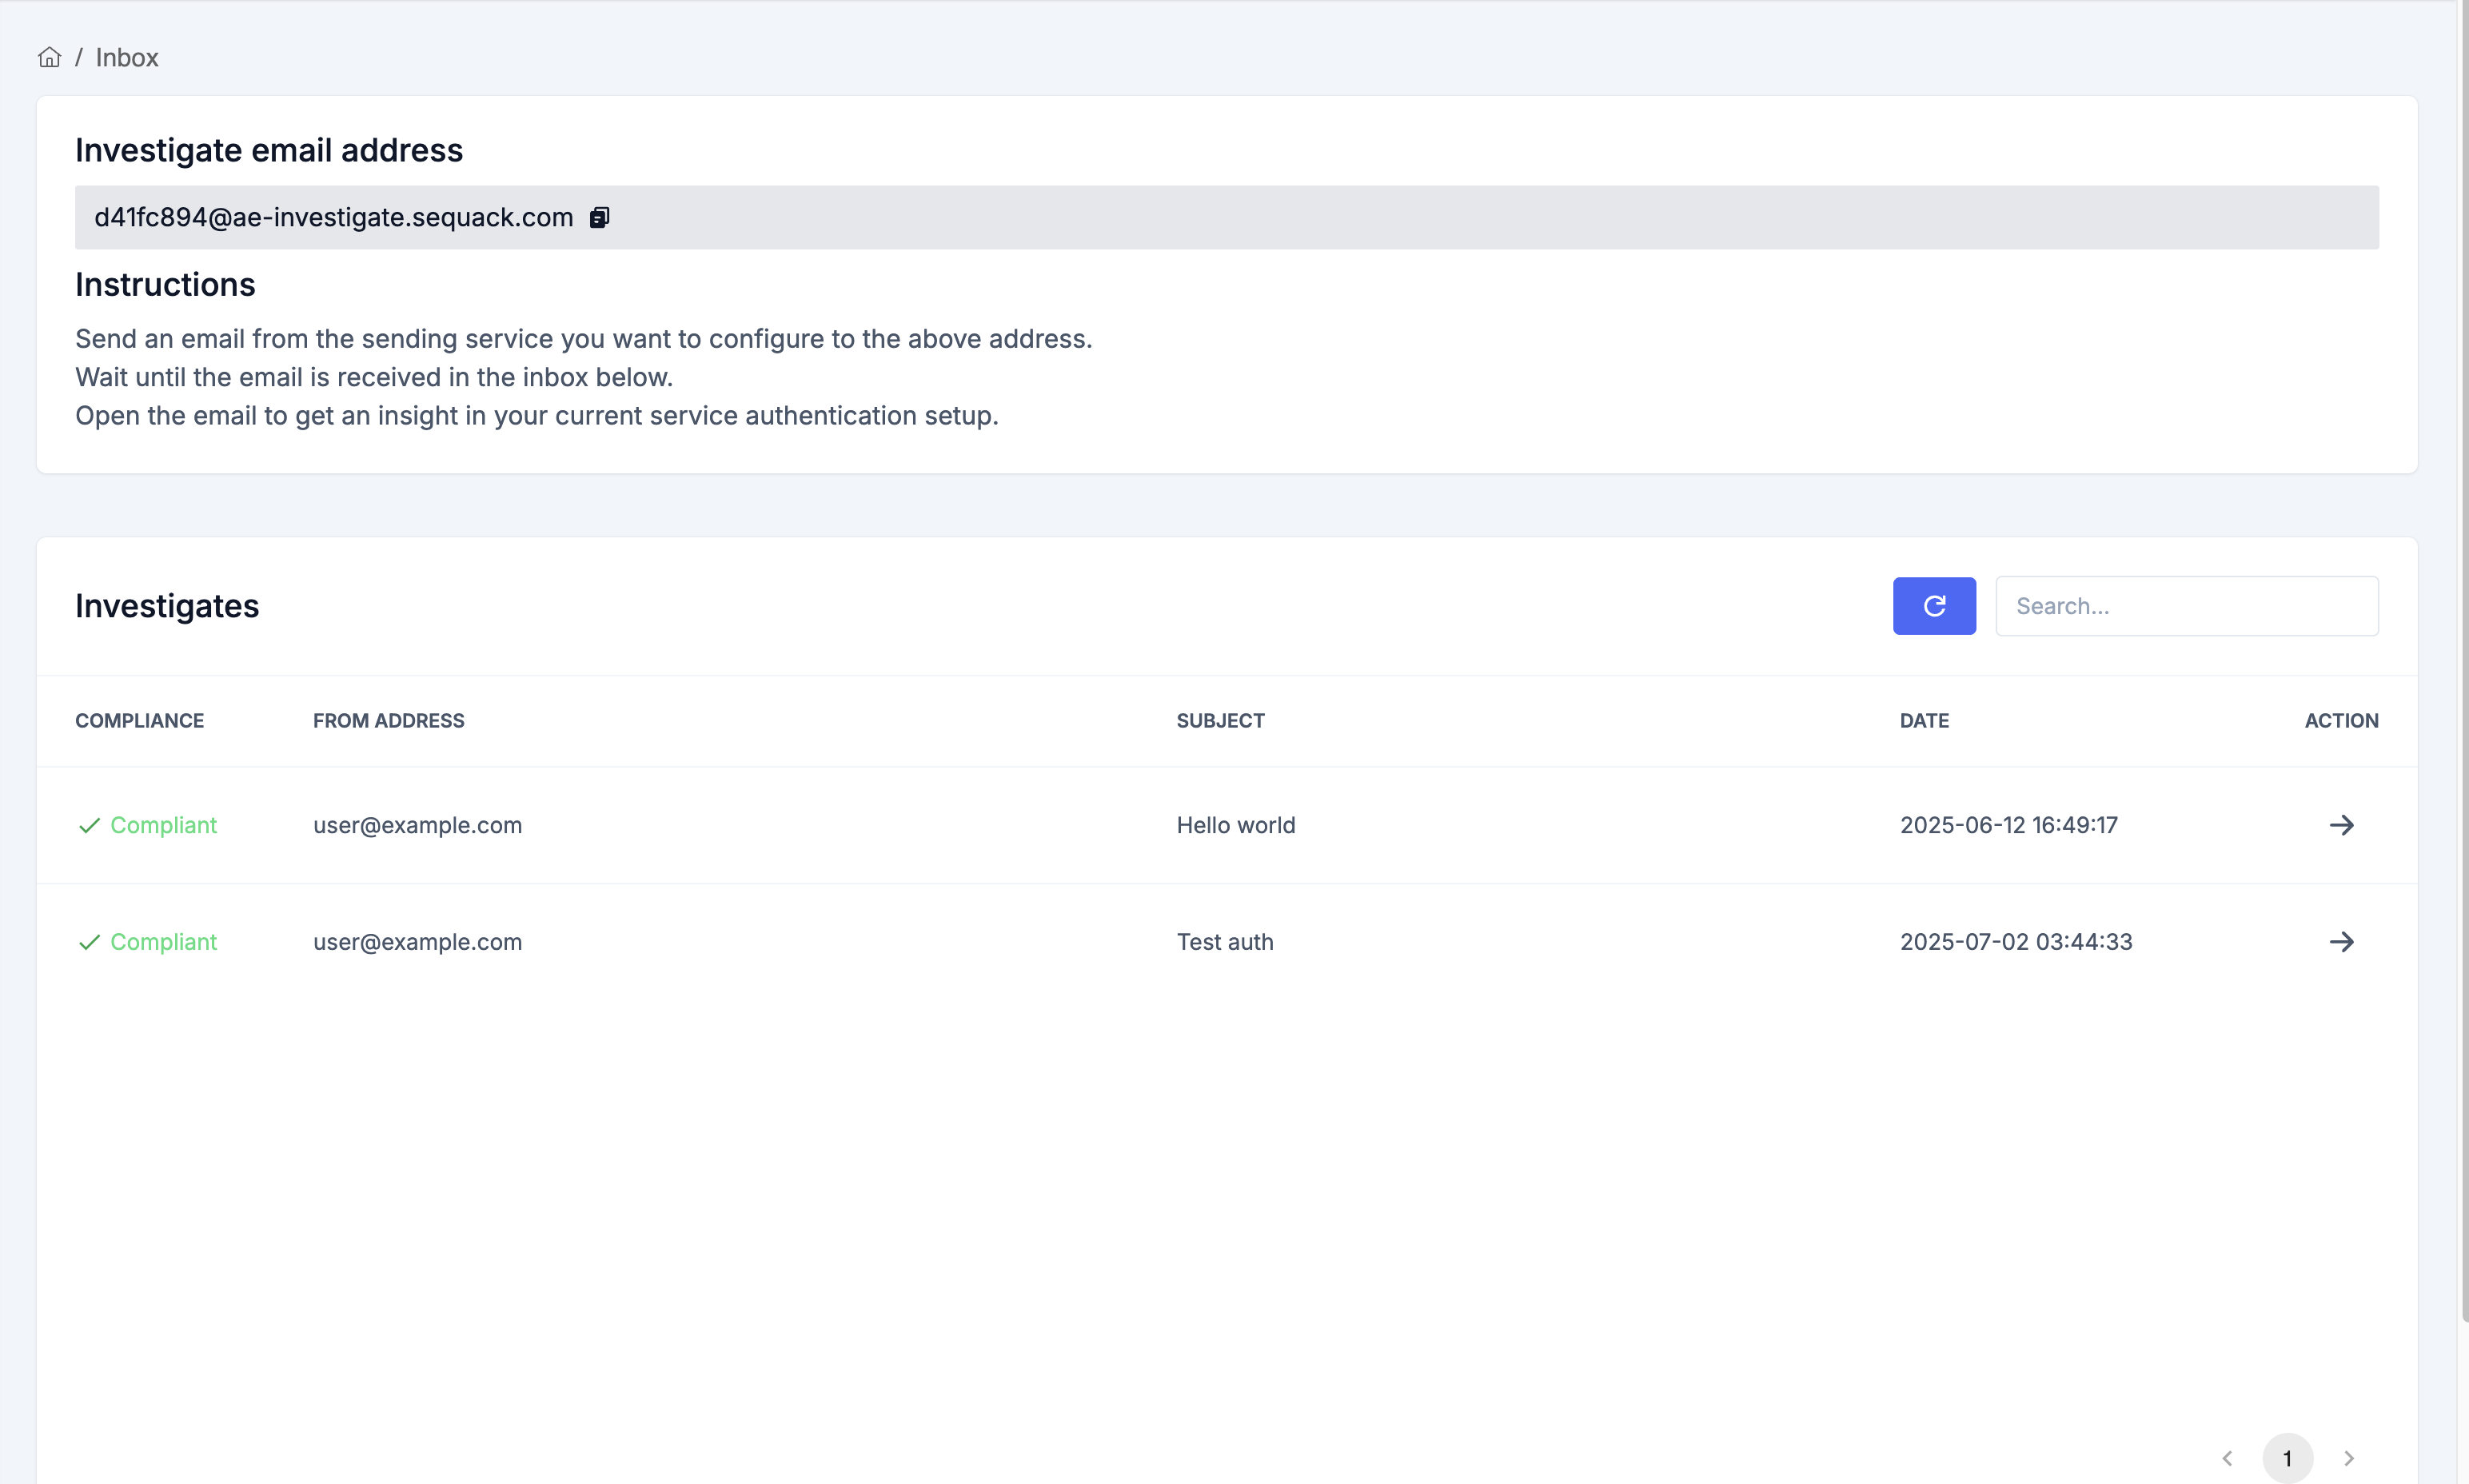
- Find your unique investigation address at the top of the Investigate page (e.g.,
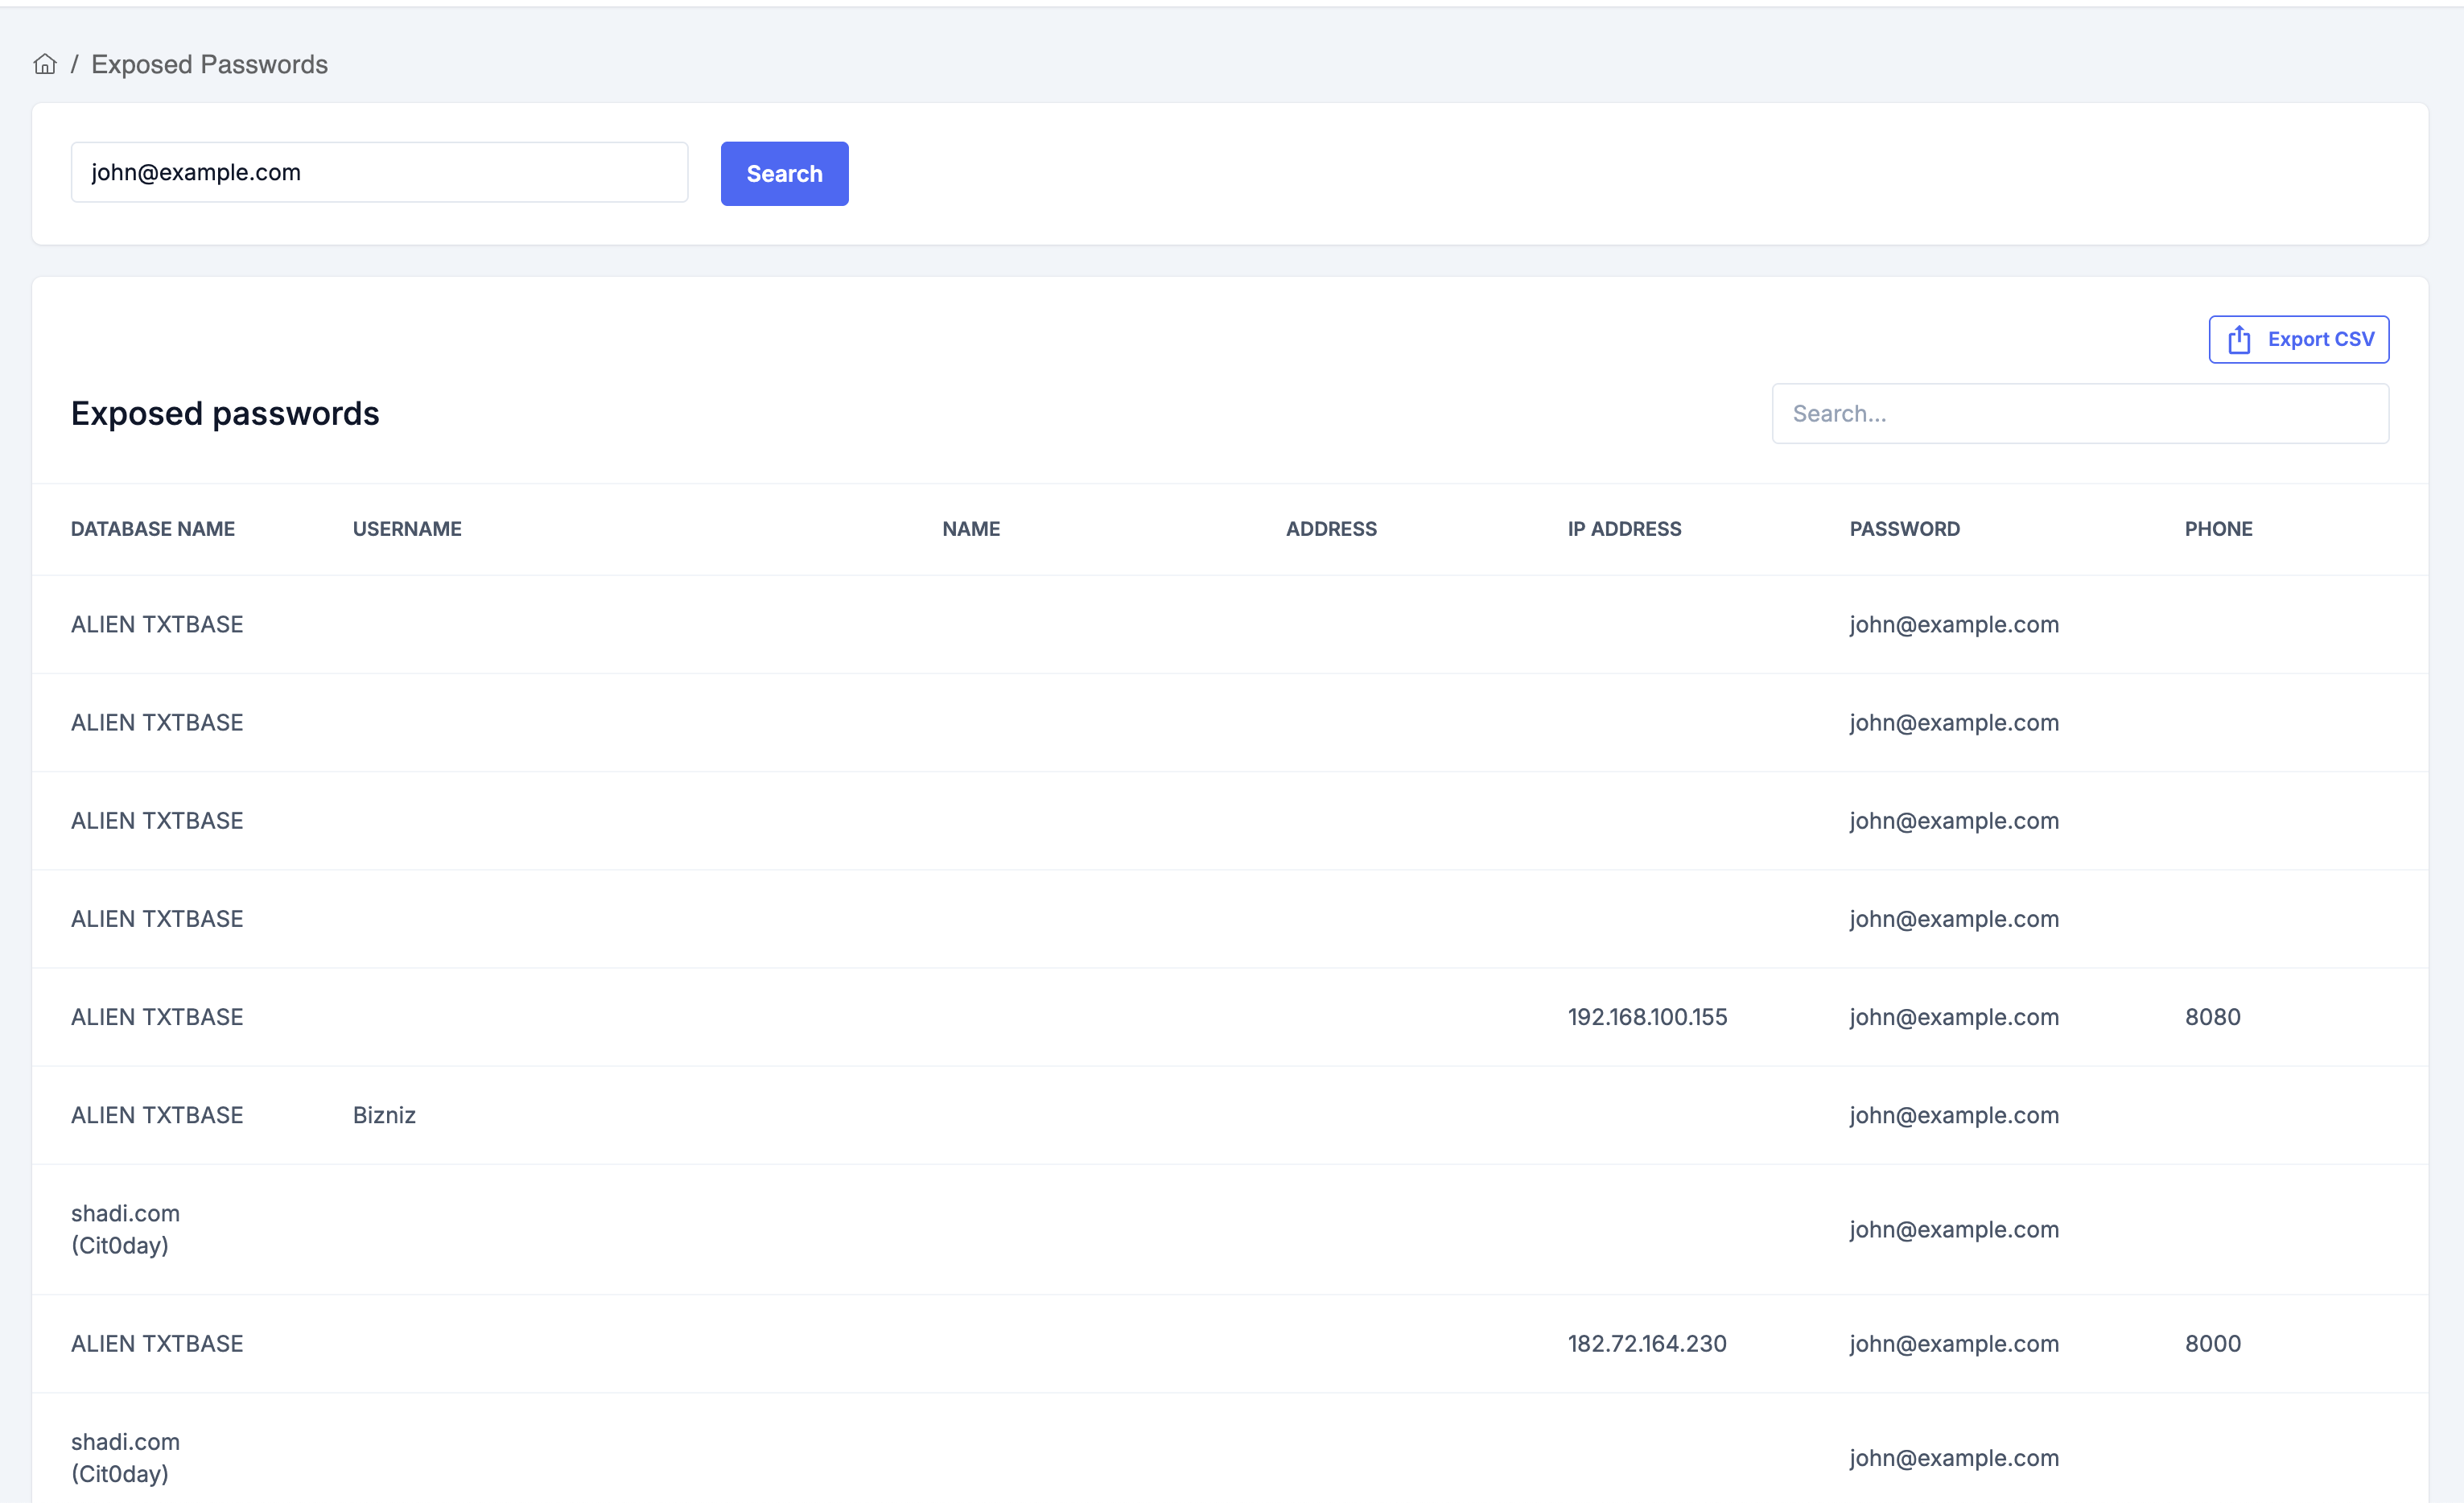
Exposed Passwords
-
Purpose: Check if an email address or domain has been found in public data breaches and see what information was exposed.
-
How it works:
- Enter an email address in the search box.
- Click "Search".
- If breaches are found, a table displays:
- Database Name
- Username
- Name
- Address
- IP Address
- Password (hashed or plain, if available)
- Phone
- Use the Export CSV button to download all results for further review.
- If no results are found, a clear message is shown.
Step 8: Configure Alerts
Stay informed about important security events with automated alerts.
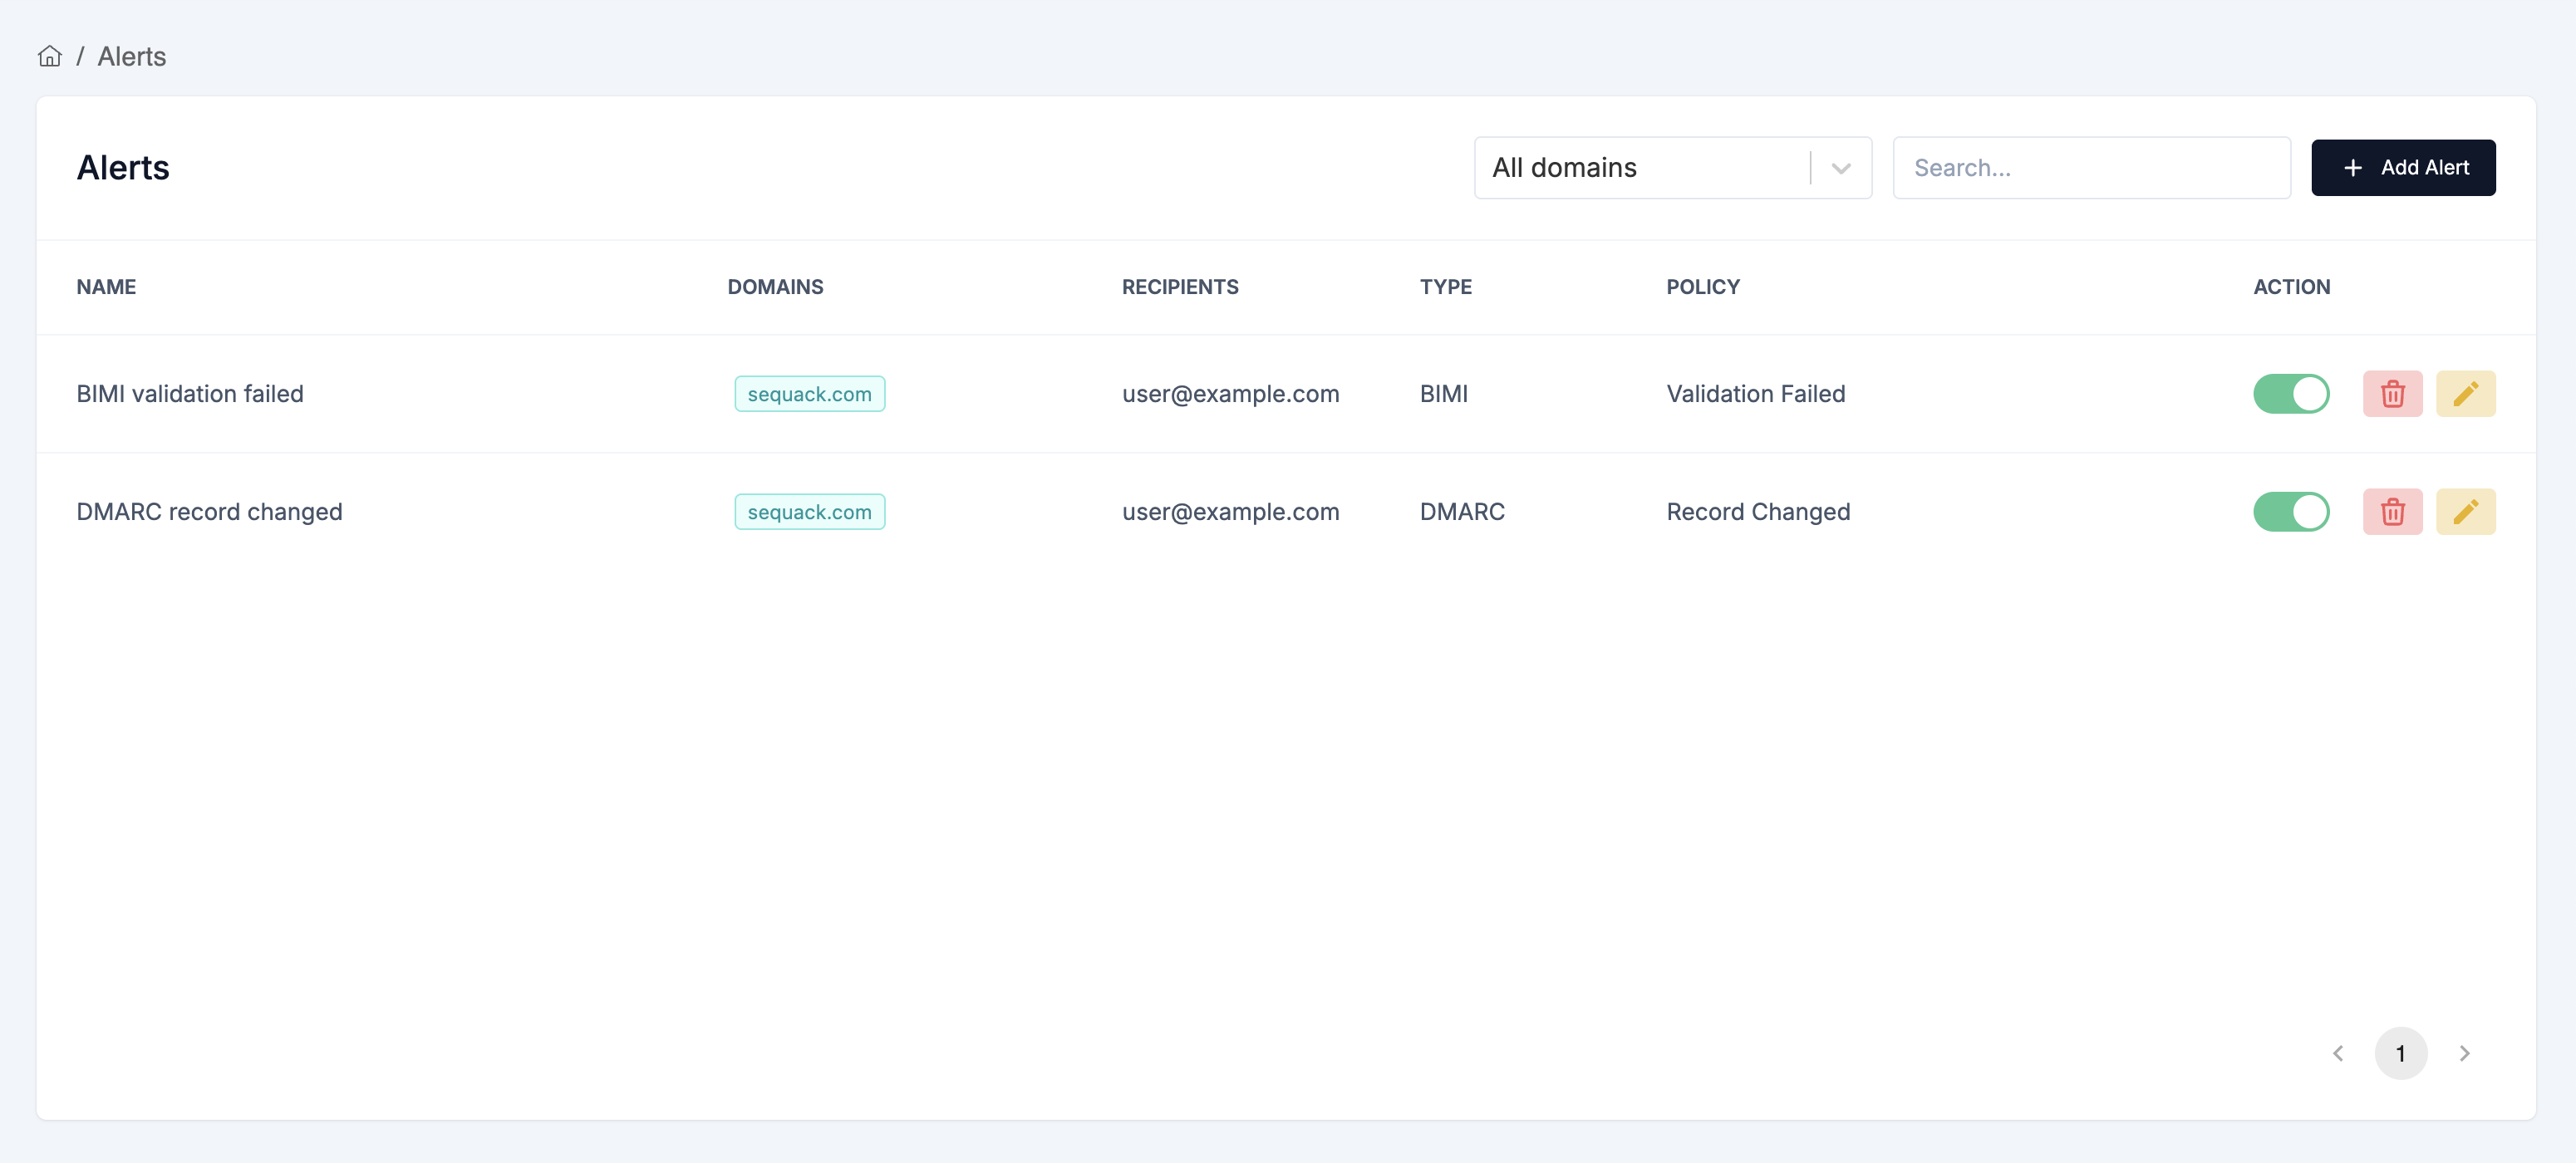
How Alerts Work
You create alert configurations in the Alerts page. These configs define what you want to be notified about (for example, DMARC record changes or validation failures). Sequack will then monitor your domains according to these configs.
To create an alert configuration:
- Go to Settings → Alerts
- Click "Create Alert"
- Choose the alert type (DMARC, SPF, DKIM, BIMI), policy (Validation failed or Record changed), domains to monitor, and recipient emails (multiple allowed).
- Click "Create Alert" to save.
How notifications are triggered: Whenever a validation fails or a record changes for a domain (according to your alert configs), Sequack will automatically generate an alert. These alerts will be shown in the Notifications page. If you added recipient emails, the alert will also be sent by email.
Step 9: Team Collaboration
Invite team members and manage access with role-based permissions.
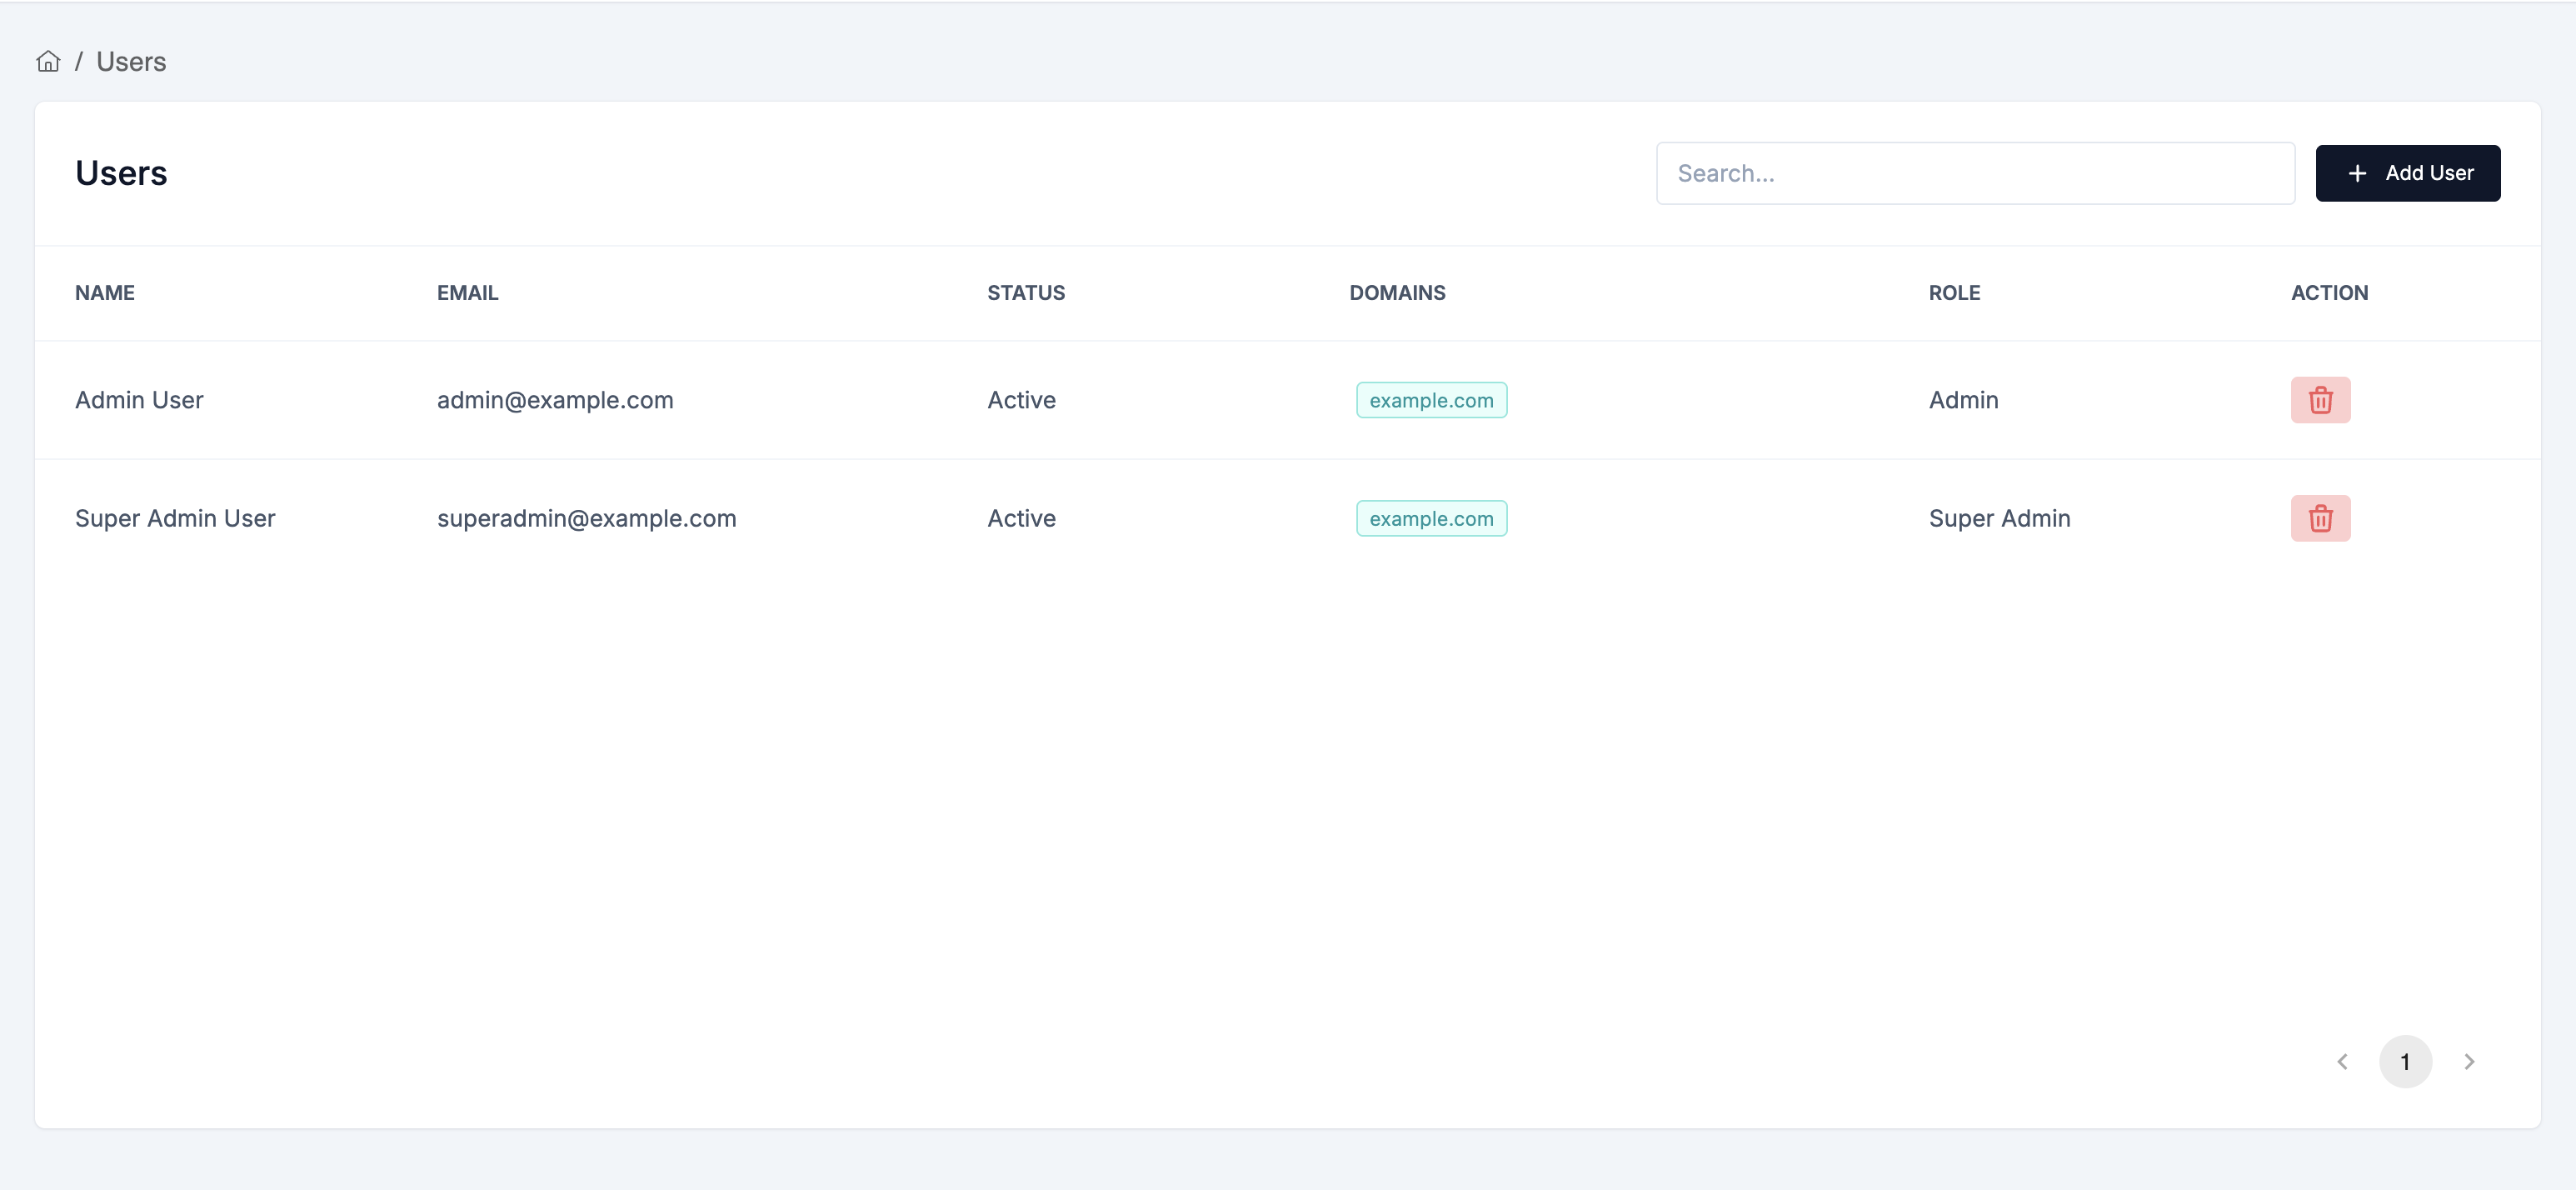
Invite Users
- Go to Settings → Users
- Click "Invite User"
- Enter their email address
- Select a role:
- Reader - View-only access to reports and dashboard
- Admin - Full access except user management, key management, org edits, audit logs
- Super Admin - Complete access to all features
- Click "Send Invitation"
The user will receive an email invitation to join your organization.
Manage Existing Users
In the Users table, you can:
- View all current users
- See their roles and last login
- Edit user roles
- Remove users from your organization
Security Tip: Regularly review user access and remove users who no longer need access.
Step 10: Profile & Security Settings
Update Your Profile
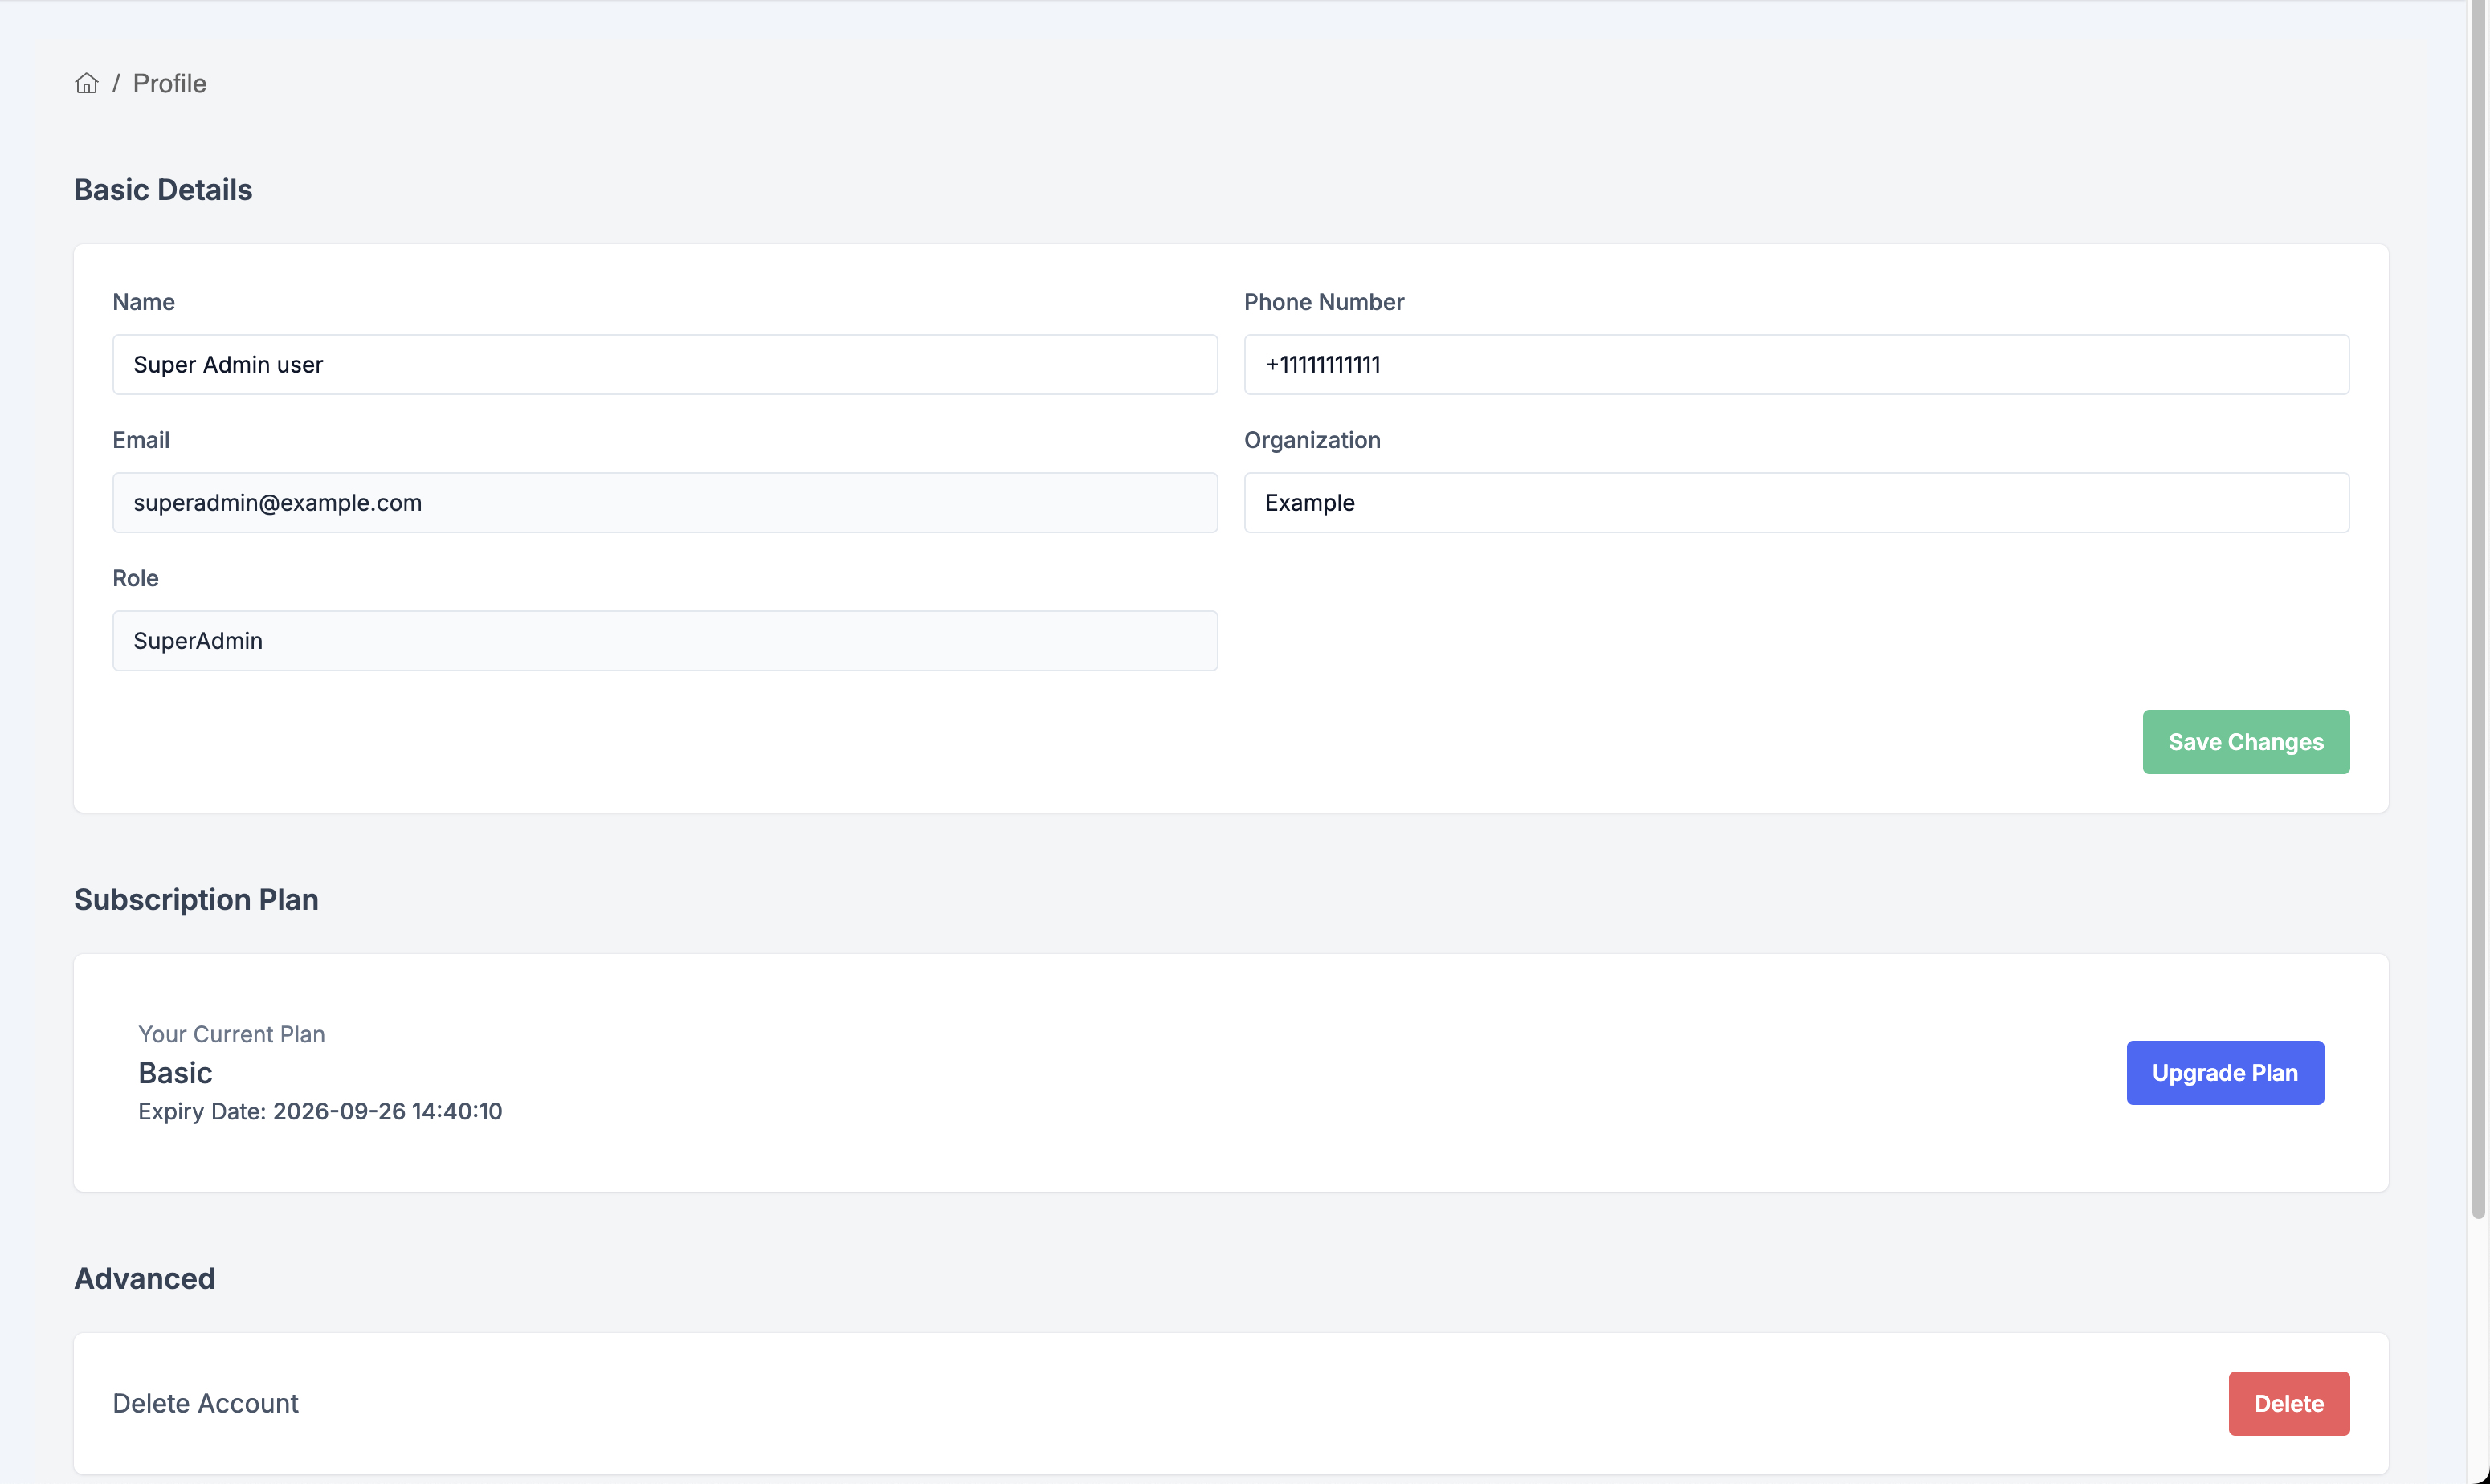
- Go to Settings → Profile
- Update your:
- Name
- Phone Number
- Organization (editable only if you are a Super Admin)
- Email (read-only)
- Role (read-only)
- Click "Save Changes"
Delete Account
If you need to delete your account:
- Scroll to the bottom of the Profile page
- Click "Delete Account"
- Confirm the deletion
Warning: Account deletion is permanent and cannot be undone. All data will be removed.
Security Settings
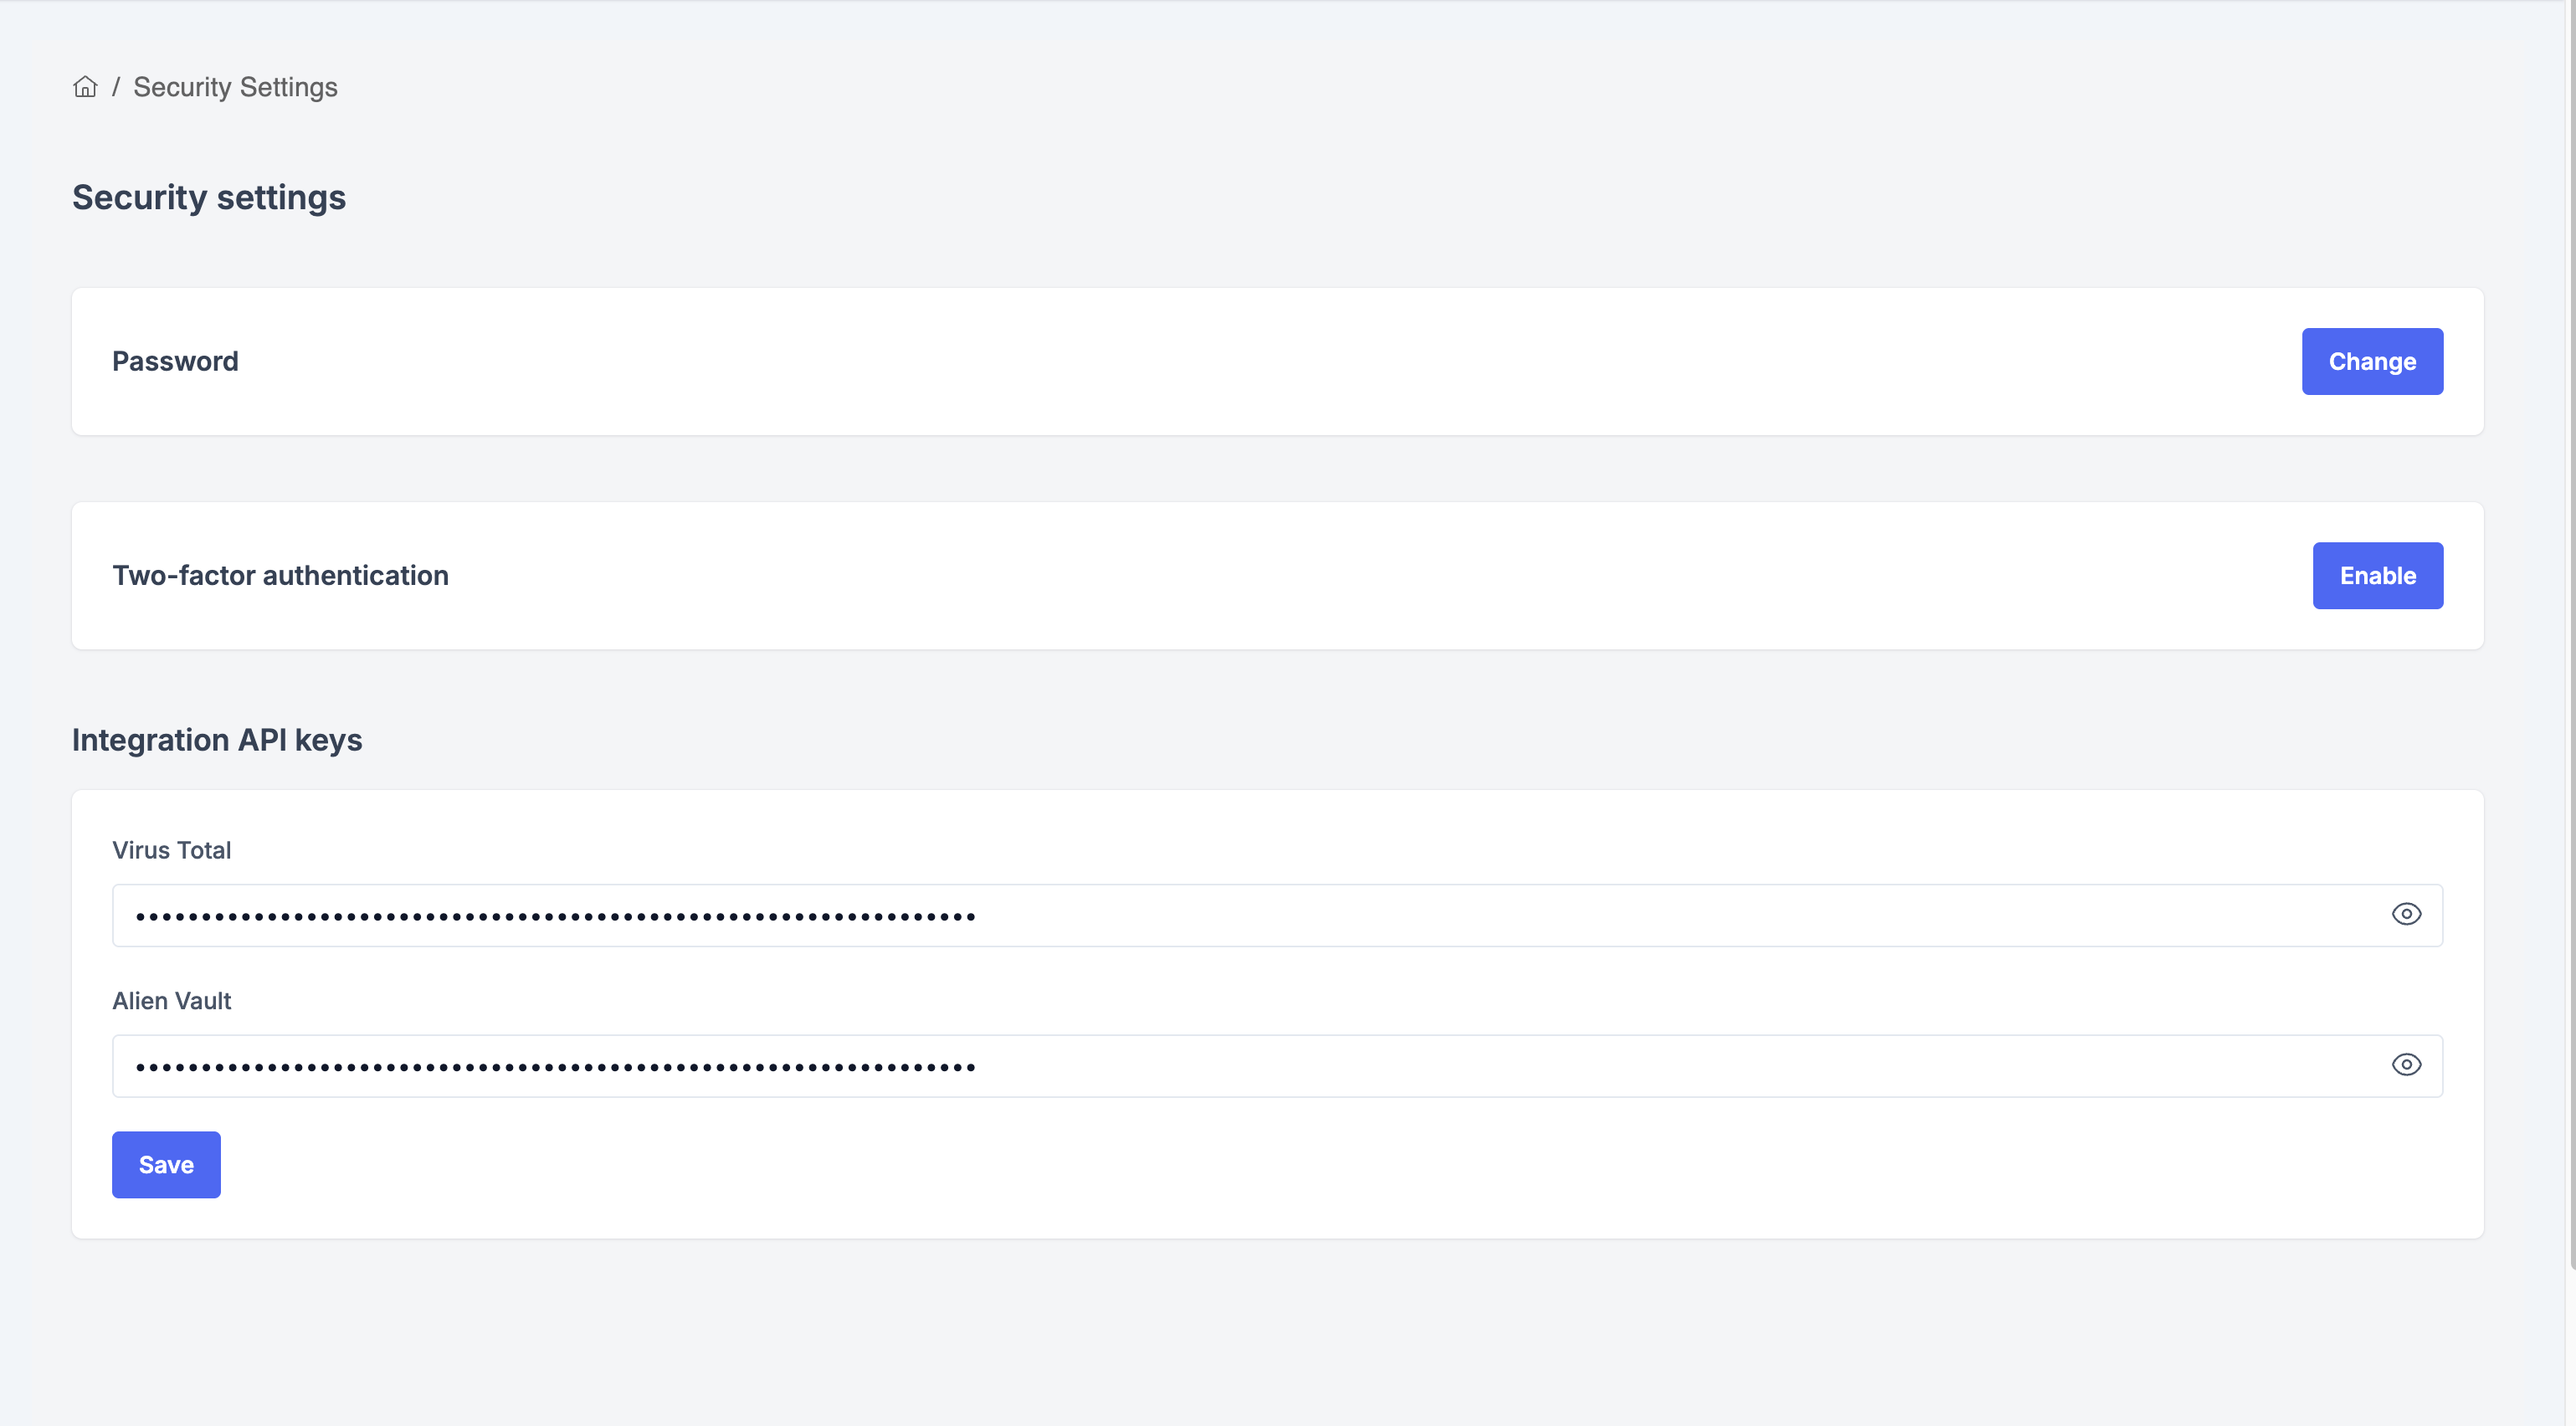
- Go to Settings → Security
Change Password
- Enter your current password
- Enter your new password
- Confirm your new password
- Click "Update Password"
Enable Two-Factor Authentication (2FA)
- Toggle "Enable 2FA"
- Scan the QR code with your authenticator app (Google Authenticator, Authy, etc.)
- Enter the 6-digit code to verify
- Save your backup codes in a safe place
API Keys Configuration
Enhance your security analysis with third-party integrations:
VirusTotal API Key
- Get your API key from VirusTotal
- Paste it in the VirusTotal API Key field
- Click "Save"
AlienVault OTX API Key
- Get your API key from AlienVault OTX
- Paste it in the AlienVault API Key field
- Click "Save"
Note: These API keys enable advanced threat intelligence in Digital Forensics.
Step 11: Monitor Activity Logs
Track all actions performed in your organization for security and compliance.
Access Activity Logs
- Go to Settings → Activity Logs
- View the comprehensive audit trail
What's Logged
Activity logs track key actions for security and compliance:
- User logins and logouts
- All database actions (such as domain additions/deletions, alert creation/modification, user invitations/edits, settings updates, API key changes, etc.) are automatically logged at the database level whenever a create, update, or delete occurs.
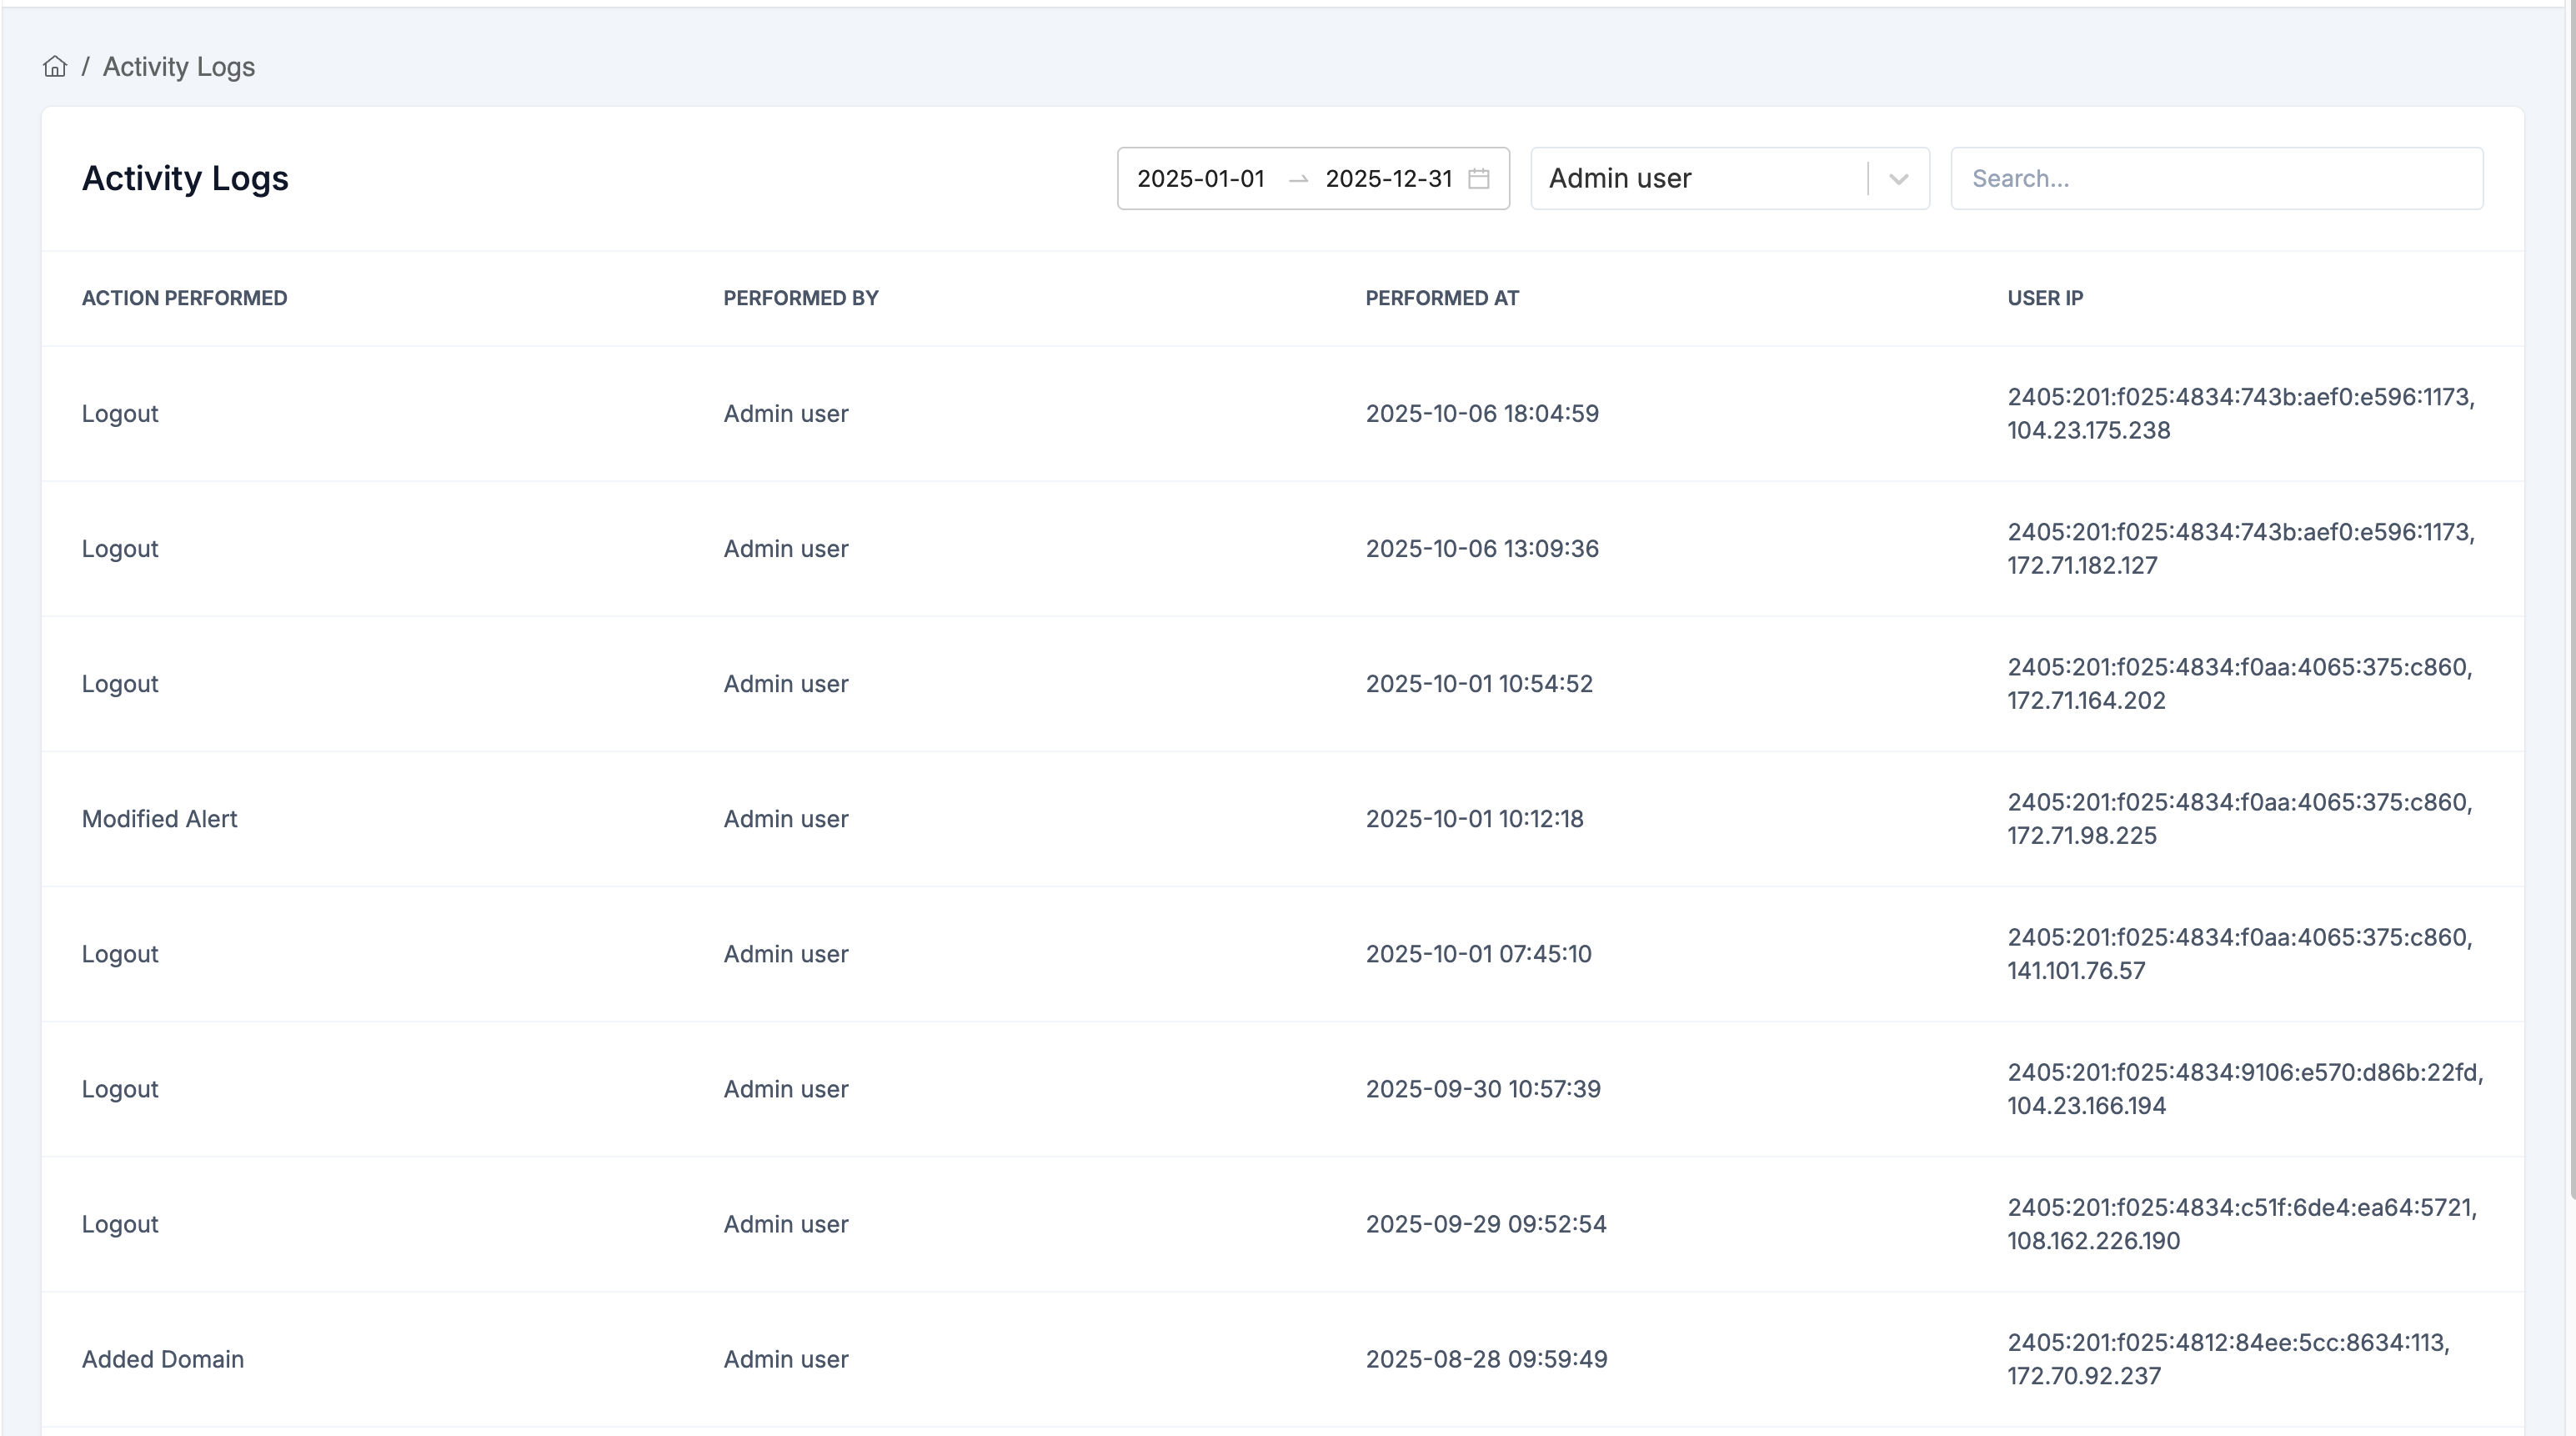
Log Information
Each entry shows:
- Action - What was performed
- Performed By - User who performed the action
- Performed At - Date and timestamp
- IP Address - Origin of the action
Getting Help
Documentation
Browse our knowledge base for detailed guides.
Support
Need assistance? We're here to help:
- Email: support@sequack.com
- Response Time: Within 24 hours for all inquiries
Last updated: October 3, 2025
Need help? Contact support@sequack.com
Ready to protect your domain?
Start monitoring your email authentication with Sequack today.
Get Started Free →Need more help?
Can't find what you're looking for? Our support team is here to help.
Contact Support →